DEPRECATED. Bar ggplot that is coloured, but not facetted.
Usage
gg_bar_col(
  data,
  x_var,
  y_var,
  col_var,
  text_var = NULL,
  stack = FALSE,
  pal = NULL,
  pal_na = "#7F7F7F",
  pal_rev = FALSE,
  alpha_fill = 1,
  alpha_line = 1,
  size_line = 0.5,
  width = NULL,
  title = NULL,
  title_wrap = 80,
  subtitle = NULL,
  subtitle_wrap = 80,
  x_zero_mid = FALSE,
  x_expand = NULL,
  x_labels = NULL,
  x_na_rm = FALSE,
  x_breaks_n = 5,
  x_rev = FALSE,
  x_title = NULL,
  x_title_wrap = 50,
  x_zero = FALSE,
  x_zero_line = NULL,
  y_zero_mid = FALSE,
  y_expand = c(0, 0),
  y_labels = scales::label_comma(),
  y_na_rm = FALSE,
  y_breaks_n = 5,
  y_title = NULL,
  y_title_wrap = 50,
  y_zero = TRUE,
  y_zero_line = NULL,
  col_breaks_n = 4,
  col_cuts = NULL,
  col_intervals_left = TRUE,
  col_labels = NULL,
  col_legend_none = FALSE,
  col_method = NULL,
  col_na_rm = FALSE,
  col_rev = FALSE,
  col_title = NULL,
  col_title_wrap = 25,
  caption = NULL,
  caption_wrap = 80,
  theme = gg_theme(y_grid = TRUE),
  mobile = FALSE
)
Arguments
- data
A data frame in a structure to be plotted untransformed. Required input.
- x_var
Unquoted variable to be on the x scale (i.e. character, factor, logical, numeric, date or datetime). If numeric, date or datetime, variable values are bins that are mutually exclusive and equidistant. Required input.
- y_var
Unquoted numeric variable to be on the y scale. Required input.
- col_var
Unquoted categorical or numeric variable to colour the bars. Required input.
- text_var
Unquoted variable to be used as a customised tooltip in combination with plotly::ggplotly(plot, tooltip = "text"). Defaults to NULL.
- stack
TRUE or FALSE of whether bars are to be positioned by "stack". Defaults to FALSE, which positions by "dodge".
- pal
Character vector of hex codes.
- pal_na
The hex code or name of the NA colour to be used.
- pal_rev
Reverses the palette. Defaults to FALSE.
- alpha_fill
The opacity of the fill. Defaults to 1.
- alpha_line
The opacity of the outline. Defaults to 1.
- size_line
The size of the outlines of bars.
- width
Width of bars. Defaults to 0.75.
- title
Title string.
- title_wrap
Number of characters to wrap the title to. Defaults to 75.
- subtitle
Subtitle string.
- subtitle_wrap
Number of characters to wrap the subtitle to. Defaults to 100.
- x_zero_mid
For a numeric x variable, add balance to the x scale so that zero is in the centre. Defaults to FALSE.
- x_expand
A vector of range expansion constants used to add padding to the x scale, as per the ggplot2 expand argument in ggplot2 scales functions.
- x_labels
A function or named vector to modify x scale labels. If NULL, categorical variable labels are converted to sentence case. Use function(x) x to keep labels untransformed.
- x_na_rm
TRUE or FALSE of whether to include x_var NA values. Defaults to FALSE.
- x_breaks_n
For a numeric or date x variable, the desired number of intervals on the x scale, as calculated by the pretty algorithm. Defaults to 5.
- x_rev
For a categorical variable, TRUE or FALSE of whether the x variable variable is reversed. Defaults to FALSE.
- x_title
X scale title string. Defaults to NULL, which converts to sentence case with spaces. Use "" if you would like no title.
- x_title_wrap
Number of characters to wrap the x title to. Defaults to 50.
- x_zero
For a numeric x variable, TRUE or FALSE of whether the minimum of the x scale is zero. Defaults to FALSE.
- x_zero_line
For a numeric x variable, TRUE or FALSE of whether to add a zero reference line to the x scale. Defaults to TRUE if there are positive and negative values in x_var. Otherwise defaults to FALSE.
- y_zero_mid
For a numeric y variable, add balance to the y scale so that zero is in the centre of the y scale.
- y_expand
A vector of range expansion constants used to add padding to the y scale, as per the ggplot2 expand argument in ggplot2 scales functions.
- y_labels
A function or named vector to modify y scale labels. Use function(x) x to keep labels untransformed.
- y_na_rm
TRUE or FALSE of whether to include y_var NA values. Defaults to FALSE.
- y_breaks_n
For a numeric or date y variable, the desired number of intervals on the y scale, as calculated by the pretty algorithm. Defaults to 5.
- y_title
y scale title string. Defaults to NULL, which converts to sentence case with spaces. Use "" if you would like no title.
- y_title_wrap
Number of characters to wrap the y title to. Defaults to 50.
- y_zero
For a numeric y variable, TRUE or FALSE of whether the minimum of the y scale is zero. Defaults to TRUE.
- y_zero_line
For a numeric y variable, TRUE or FALSE whether to add a zero reference line to the y scale. Defaults to TRUE if there are positive and negative values in y_var. Otherwise defaults to FALSE.
- col_breaks_n
For a numeric colour variable, the desired number of intervals on the colour scale.
- col_cuts
A vector of cuts to colour a numeric variable. If "bin" is selected, the first number in the vector should be either -Inf or 0, and the final number Inf. If "quantile" is selected, the first number in the vector should be 0 and the final number should be 1. Defaults to quartiles.
- col_intervals_left
For a numeric colour variable, TRUE or FALSE of whether bins or quantiles are to be cut left-closed. Defaults to TRUE.
- col_labels
A function or named vector to modify colour scale labels. Defaults to snakecase::to_sentence_case for categorical colour variables and scales::label_comma() for numeric. Use function(x) x to keep labels untransformed.
- col_legend_none
TRUE or FALSE of whether to remove the legend.
- col_method
The method of colouring features, either "bin", "quantile", "continuous", or "category." If numeric, defaults to "bin".
- col_na_rm
TRUE or FALSE of whether to include col_var NA values. Defaults to FALSE.
- col_rev
TRUE or FALSE of whether the colour scale is reversed. Defaults to FALSE.
- col_title
Colour title string for the legend. Defaults to NULL, which converts to sentence case with spaces. Use "" if you would like no title.
- col_title_wrap
Number of characters to wrap the colour title to. Defaults to 25. Not applicable where mobile equals TRUE.
- caption
Caption title string.
- caption_wrap
Number of characters to wrap the caption to. Defaults to 80.
- theme
A ggplot2 theme.
- mobile
Whether the plot is to be displayed on a mobile device. Defaults to FALSE.
Examples
library(dplyr)
library(simplevis)
library(palmerpenguins)
plot_data <- penguins %>%
group_by(species, sex) %>%
summarise(body_mass_g = mean(body_mass_g, na.rm = TRUE))
#> `summarise()` has grouped output by 'species'. You can override using the
#> `.groups` argument.
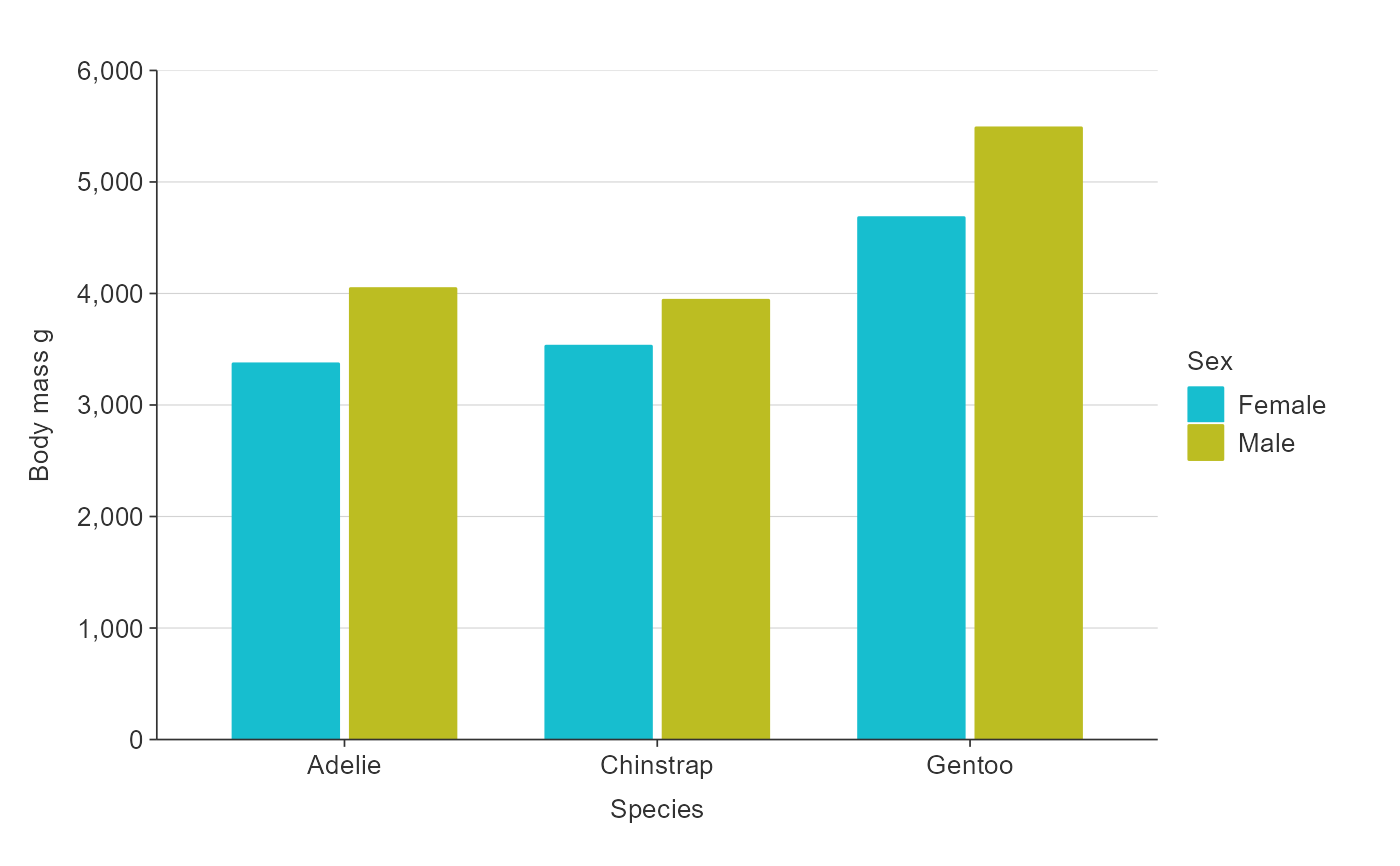
gg_bar_col(plot_data,
x_var = species,
y_var = body_mass_g,
col_var = sex,
col_na_rm = TRUE)
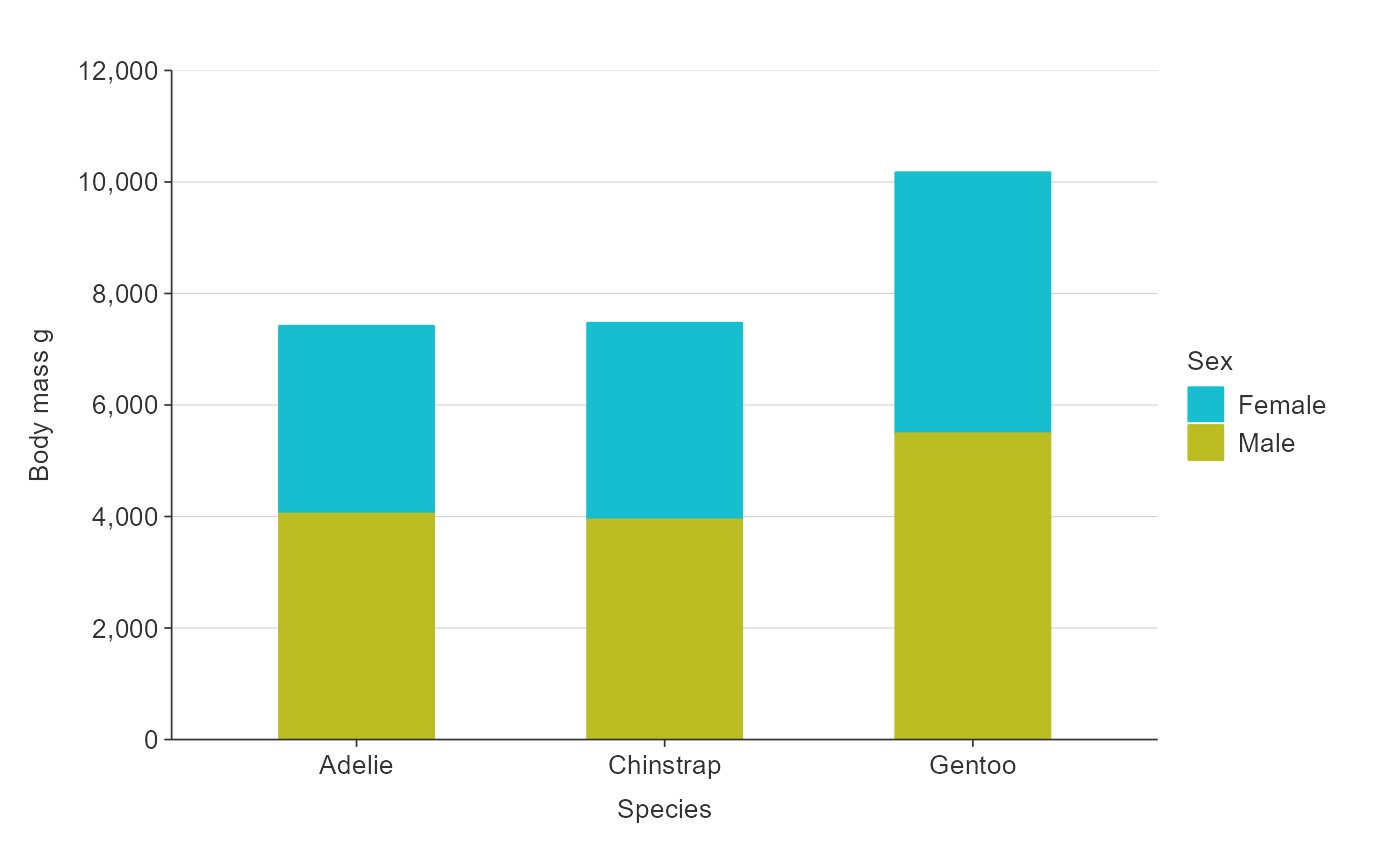
 gg_bar_col(plot_data,
x_var = species,
y_var = body_mass_g,
col_var = sex,
col_na_rm = TRUE,
stack = TRUE,
width = 0.5)
gg_bar_col(plot_data,
x_var = species,
y_var = body_mass_g,
col_var = sex,
col_na_rm = TRUE,
stack = TRUE,
width = 0.5)