DEPRECATED. Horizontal boxplot ggplot that is coloured, but not facetted.
Usage
gg_hboxplot_col(
  data,
  x_var = NULL,
  y_var,
  col_var,
  pal = NULL,
  pal_na = "#7F7F7F",
  pal_rev = FALSE,
  alpha_fill = 0.5,
  alpha_line = 1,
  alpha_point = 1,
  size_line = 0.5,
  size_point = 1.5,
  width = 0.5,
  title = NULL,
  title_wrap = 75,
  subtitle = NULL,
  subtitle_wrap = 75,
  x_zero_mid = FALSE,
  x_breaks_n = 5,
  x_expand = c(0, 0),
  x_labels = scales::label_comma(),
  x_title = NULL,
  x_title_wrap = 50,
  x_zero = FALSE,
  x_zero_line = NULL,
  y_expand = ggplot2::waiver(),
  y_labels = snakecase::to_sentence_case,
  y_na_rm = FALSE,
  y_rev = FALSE,
  y_title = NULL,
  y_title_wrap = 50,
  col_labels = stringr::str_to_sentence,
  col_legend_none = FALSE,
  col_na_rm = FALSE,
  col_rev = FALSE,
  col_title = NULL,
  col_title_wrap = 25,
  caption = NULL,
  caption_wrap = 75,
  theme = gg_theme(x_grid = TRUE),
  stat = "boxplot",
  xmin_var = NULL,
  xlower_var = NULL,
  xmiddle_var = NULL,
  xupper_var = NULL,
  xmax_var = NULL,
  mobile = FALSE
)
Arguments
- data
An ungrouped summarised tibble or data frame generally in a structure to be transformed to boxplot statistics (or alternatively in a structure of summary boxplot statistics). Required input.
- x_var
Unquoted numeric variable to be on the x scale for when stat = "boxplot" is selected.
- y_var
Unquoted categorical variable to be on the y scale (i.e. character, factor, or logical). Required input.
- col_var
Unquoted categorical or numeric variable to colour the boxplots. Required input.
- pal
Character vector of hex codes.
- pal_na
The hex code or name of the NA colour to be used.
- pal_rev
Reverses the palette. Defaults to FALSE.
- alpha_fill
The opacity of the fill. Defaults to 0.5.
- alpha_line
The opacity of the outline. Defaults to 1.
- alpha_point
The opacity of the outlier points. Defaults to 1.
- size_line
The size of the outlines of boxplots. Defaults to 0.5.
- size_point
The size of the outlier points. Defaults to 1.5.
- width
Width of boxes. Defaults to 0.5.
- title
Title string.
- title_wrap
Number of characters to wrap the title to. Defaults to 60.
- subtitle
Subtitle string.
- subtitle_wrap
Number of characters to wrap the subtitle to. Defaults to 60.
- x_zero_mid
For a numeric x variable, add balance to the x scale so that zero is in the centre of the x scale.
- x_breaks_n
For a numeric or date x variable, the desired number of intervals on the x scale, as calculated by the pretty algorithm. Defaults to 2.
- x_expand
A vector of range expansion constants used to add padding to the x scale, as per the ggplot2 expand argument in ggplot2 scales functions.
- x_labels
A function or named vector to modify x scale labels. Use ggplot2::waiver() to keep x labels untransformed.
- x_title
X scale title string. Defaults to NULL, which converts to sentence case with spaces. Use "" if you would like no title.
- x_title_wrap
Number of characters to wrap the x title to. Defaults to 50.
- x_zero
For a numeric x variable, TRUE or FALSE of whether the minimum of the x scale is zero. Defaults to FALSE.
- x_zero_line
For a numeric x variable, TRUE or FALSE whether to add a zero reference line to the x scale. Defaults to TRUE if there are positive and negative values in x_var. Otherwise defaults to FALSE.
- y_expand
A vector of range expansion constants used to add padding to the y scale, as per the ggplot2 expand argument in ggplot2 scales functions.
- y_labels
A function or named vector to modify y scale labels. If NULL, categorical variable labels are converted to sentence case. Use ggplot2::waiver() to keep y labels untransformed.
- y_na_rm
TRUE or FALSE of whether to include y_var NA values. Defaults to FALSE.
- y_rev
For a categorical variable, TRUE or FALSE of whether the y variable variable is reversed. Defaults to FALSE.
- y_title
y scale title string. Defaults to NULL, which converts to sentence case with spaces. Use "" if you would like no title.
- y_title_wrap
Number of characters to wrap the y title to. Defaults to 50.
- col_labels
A function or named vector to modify colour scale labels. Defaults to snakecase::to_sentence_case for categorical colour variables and scales::number for numeric colour variables. Use ggplot2::waiver() to keep colour labels untransformed.
- col_legend_none
TRUE or FALSE of whether to remove the legend.
- col_na_rm
TRUE or FALSE of whether to include col_var NA values. Defaults to FALSE.
- col_rev
TRUE or FALSE of whether the colour scale is reversed. Defaults to FALSE.
- col_title
Colour title string for the legend. Defaults to NULL, which converts to sentence case with spaces. Use "" if you would like no title.
- col_title_wrap
Number of characters to wrap the colour title to. Defaults to 25. Not applicable where mobile equals TRUE.
- caption
Caption title string.
- caption_wrap
Number of characters to wrap the caption to. Defaults to 75.
- theme
A ggplot2 theme.
- stat
String of "boxplot" or "identity". Defaults to "boxplot".
- xmin_var
Unquoted numeric variable for minimum of whisker on the x scale for when stat = "identity" is selected.
- xlower_var
Unquoted numeric variable for minimum of box on the x scale for when stat = "identity" is selected.
- xmiddle_var
Unquoted numeric variable for middle of box on the x scale for when stat = "identity" is selected.
- xupper_var
Unquoted numeric variable for maximum of box on the x scale for when stat = "identity" is selected.
- xmax_var
Unquoted numeric variable for maximum of whisker on the x scale for when stat = "identity" is selected.
- mobile
Whether the plot is to be displayed on a mobile device. Defaults to FALSE.
Examples
library(simplevis)
library(dplyr)
library(palmerpenguins)
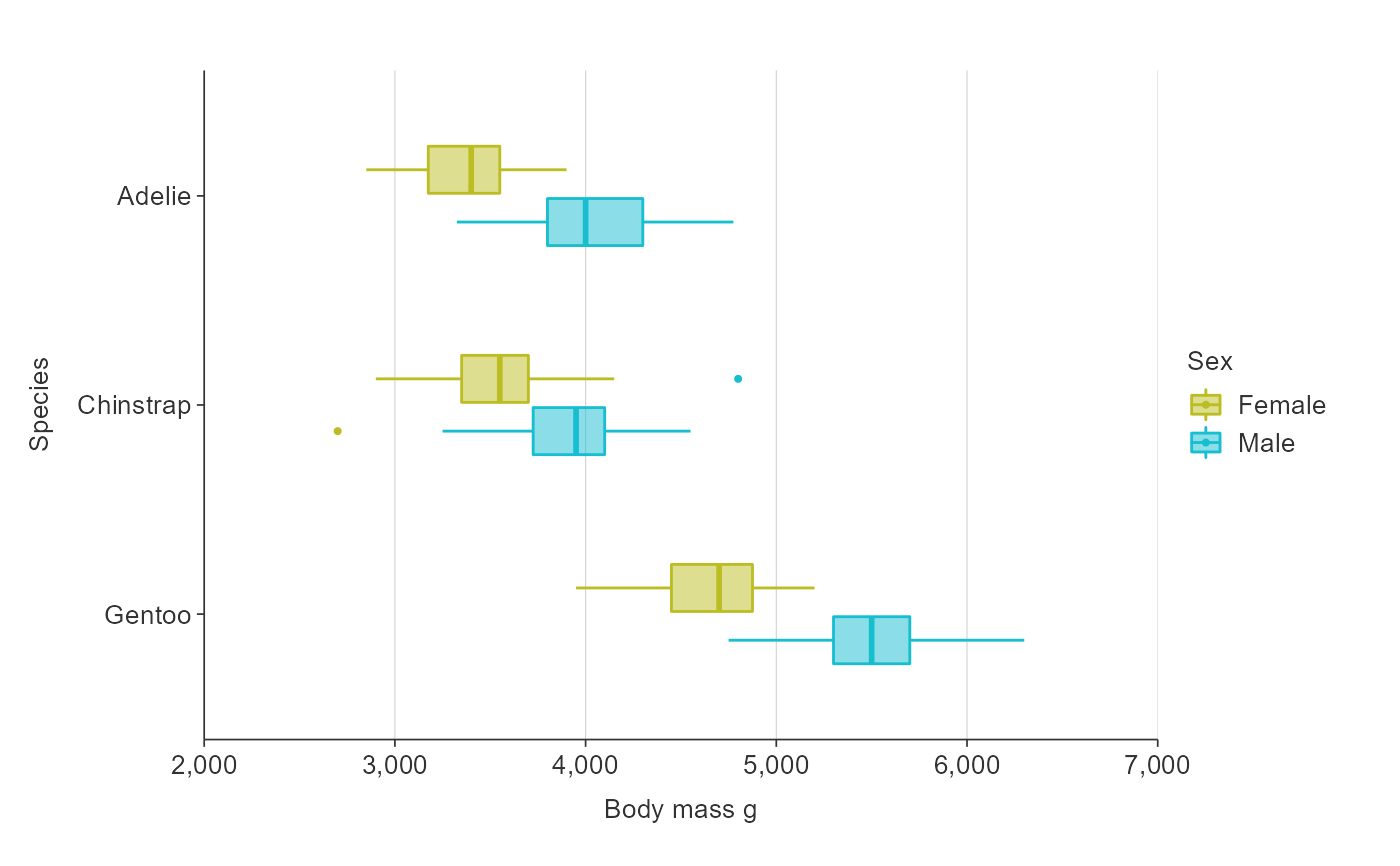
gg_hboxplot_col(penguins,
x_var = body_mass_g,
y_var = species,
col_var = sex,
col_na_rm = TRUE)
 #For ggplotly, pipe in plotly::layout(boxmode = "group") layer
plot_data <- penguins %>%
group_by(species, sex) %>%
summarise_boxplot_stats(body_mass_g)
outliers <- penguins %>%
group_by(species, sex) %>%
summarise_boxplot_outliers(body_mass_g)
width <- 0.5
gg_hboxplot_col(plot_data,
xmin_var = min,
xlower_var = lower,
xmiddle_var = middle,
xupper_var = upper,
xmax_var = max,
y_var = species,
col_var = sex,
width = width,
stat = "identity",
x_title = "Body mass g",
x_breaks_n = 4,
col_na_rm = TRUE) +
ggplot2::geom_point(ggplot2::aes(x = species, y = body_mass_g, col = sex),
size = 0.75,
position = ggplot2::position_dodge(width = width),
data = outliers)
#For ggplotly, pipe in plotly::layout(boxmode = "group") layer
plot_data <- penguins %>%
group_by(species, sex) %>%
summarise_boxplot_stats(body_mass_g)
outliers <- penguins %>%
group_by(species, sex) %>%
summarise_boxplot_outliers(body_mass_g)
width <- 0.5
gg_hboxplot_col(plot_data,
xmin_var = min,
xlower_var = lower,
xmiddle_var = middle,
xupper_var = upper,
xmax_var = max,
y_var = species,
col_var = sex,
width = width,
stat = "identity",
x_title = "Body mass g",
x_breaks_n = 4,
col_na_rm = TRUE) +
ggplot2::geom_point(ggplot2::aes(x = species, y = body_mass_g, col = sex),
size = 0.75,
position = ggplot2::position_dodge(width = width),
data = outliers)