DEPRECATED. Line ggplot that is coloured and facetted.
Usage
gg_line_col_facet(
  data,
  x_var,
  y_var,
  col_var,
  facet_var,
  text_var = NULL,
  pal = NULL,
  pal_na = "#7F7F7F",
  pal_rev = FALSE,
  alpha_line = 1,
  alpha_point = 1,
  size_point = 1.5,
  size_line = 0.5,
  title = NULL,
  title_wrap = 80,
  subtitle = NULL,
  subtitle_wrap = 80,
  x_zero_mid = FALSE,
  x_breaks_n = 2,
  x_expand = NULL,
  x_labels = NULL,
  x_na_rm = FALSE,
  x_rev = FALSE,
  x_title = NULL,
  x_title_wrap = 50,
  x_zero = FALSE,
  x_zero_line = NULL,
  y_zero_mid = FALSE,
  y_breaks_n = 3,
  y_expand = c(0, 0),
  y_labels = scales::label_comma(),
  y_na_rm = FALSE,
  y_title = NULL,
  y_title_wrap = 50,
  y_zero = FALSE,
  y_zero_line = NULL,
  col_labels = snakecase::to_sentence_case,
  col_legend_none = FALSE,
  col_na_rm = FALSE,
  col_title = NULL,
  col_title_wrap = 25,
  facet_labels = snakecase::to_sentence_case,
  facet_na_rm = FALSE,
  facet_ncol = NULL,
  facet_nrow = NULL,
  facet_rev = FALSE,
  facet_scales = "fixed",
  caption = NULL,
  caption_wrap = 80,
  theme = gg_theme(y_grid = TRUE)
)
Arguments
- data
A data frame in a structure to be plotted untransformed. Required input.
- x_var
Unquoted variable to be on the x scale (i.e. character, factor, logical, numeric, date or datetime). Required input.
- y_var
Unquoted numeric variable to be on the y scale. Required input.
- col_var
Unquoted categorical variable for lines and points to be coloured by. Required input.
- facet_var
Unquoted categorical variable to facet the data by. Required input.
- text_var
Unquoted variable to be used as a customised tooltip in combination with plotly::ggplotly(plot, tooltip = "text"). Defaults to NULL.
- pal
Character vector of hex codes.
- pal_na
The hex code or name of the NA colour to be used.
- pal_rev
Reverses the palette. Defaults to FALSE.
- alpha_line
The opacity of the line. Defaults to 1.
- alpha_point
The opacity of the points.
- size_point
Size of points. Defaults to 1.5.
- size_line
Size of lines. Defaults to 0.5.
- title
Title string.
- title_wrap
Number of characters to wrap the title to. Defaults to 100.
- subtitle
Subtitle string.
- subtitle_wrap
Number of characters to wrap the subtitle to. Defaults to 100.
- x_zero_mid
For a numeric x variable, add balance to the x scale so that zero is in the centre. Defaults to FALSE.
- x_breaks_n
For a numeric or date x variable, the desired number of intervals on the x scale, as calculated by the pretty algorithm. Defaults to 2.
- x_expand
A vector of range expansion constants used to add padding to the x scale, as per the ggplot2 expand argument in ggplot2 scales functions.
- x_labels
A function or named vector to modify x scale labels. If NULL, categorical variable labels are converted to sentence case. Use ggplot2::waiver() to keep x labels untransformed.
- x_na_rm
TRUE or FALSE of whether to include x_var NA values. Defaults to FALSE.
- x_rev
For a categorical x variable, TRUE or FALSE of whether the x variable variable is reversed. Defaults to FALSE.
- x_title
X scale title string. Defaults to NULL, which converts to sentence case with spaces. Use "" if you would like no title.
- x_title_wrap
Number of characters to wrap the x title to. Defaults to 50.
- x_zero
For a numeric x variable, TRUE or FALSE of whether the minimum of the x scale is zero. Defaults to FALSE.
- x_zero_line
For a numeric x variable, TRUE or FALSE of whether to add a zero reference line to the x scale. Defaults to TRUE if there are positive and negative values in x_var. Otherwise defaults to FALSE.
- y_zero_mid
For a numeric y variable, add balance to the y scale so that zero is in the centre of the y scale.
- y_breaks_n
For a numeric or date x variable, the desired number of intervals on the x scale, as calculated by the pretty algorithm. Defaults to 4.
- y_expand
A vector of range expansion constants used to add padding to the y scale, as per the ggplot2 expand argument in ggplot2 scales functions.
- y_labels
A function or named vector to modify y scale labels. Use ggplot2::waiver() to keep y labels untransformed.
- y_na_rm
TRUE or FALSE of whether to include y_var NA values. Defaults to FALSE.
- y_title
y scale title string. Defaults to NULL, which converts to sentence case with spaces. Use "" if you would like no title.
- y_title_wrap
Number of characters to wrap the y title to. Defaults to 50.
- y_zero
For a numeric y variable, TRUE or FALSE of whether the minimum of the y scale is zero. Defaults to TRUE.
- y_zero_line
For a numeric y variable, TRUE or FALSE whether to add a zero reference line to the y scale. Defaults to TRUE if there are positive and negative values in y_var. Otherwise defaults to FALSE.
- col_labels
A function or named vector to modify colour scale labels. Use ggplot2::waiver() to keep colour labels untransformed.
- col_legend_none
TRUE or FALSE of whether to remove the legend.
- col_na_rm
TRUE or FALSE of whether to include col_var NA values. Defaults to FALSE.
- col_title
Colour title string for the legend. Defaults to NULL, which converts to sentence case with spaces. Use "" if you would like no title.
- col_title_wrap
Number of characters to wrap the colour title to. Defaults to 25.
- facet_labels
A function or named vector to modify facet scale labels. Defaults to converting labels to sentence case. Use ggplot2::waiver() to keep facet labels untransformed.
- facet_na_rm
TRUE or FALSE of whether to include facet_var NA values. Defaults to FALSE.
- facet_ncol
The number of columns of facetted plots.
- facet_nrow
The number of rows of facetted plots.
- facet_rev
TRUE or FALSE of whether the facet variable variable is reversed. Defaults to FALSE.
- facet_scales
Whether facet_scales should be "fixed" across facets, "free" in both directions, or free in just one direction (i.e. "free_x" or "free_y"). Defaults to "fixed".
- caption
Caption title string.
- caption_wrap
Number of characters to wrap the caption to. Defaults to 80.
- theme
A ggplot2 theme.
Examples
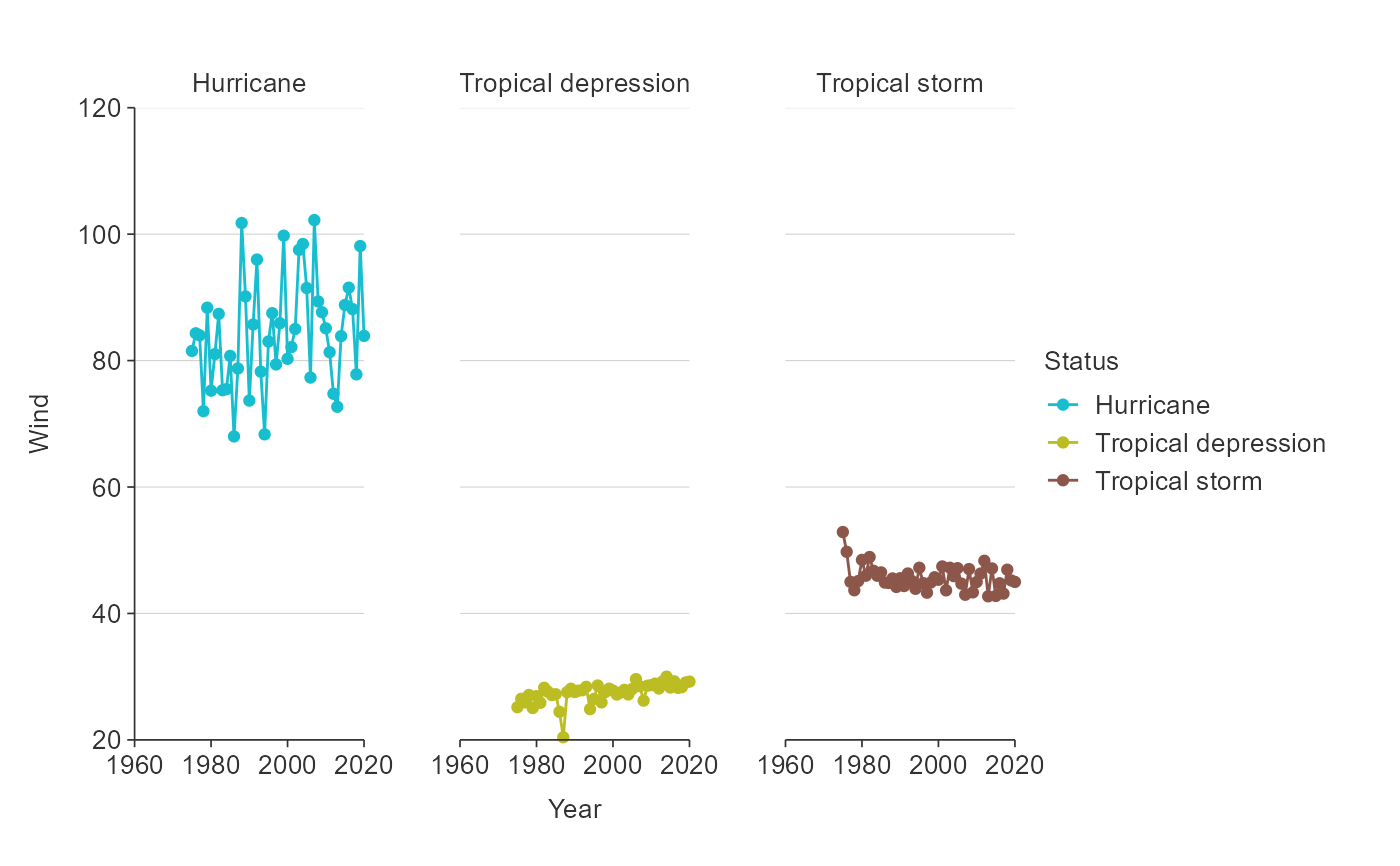
library(simplevis)
library(dplyr)

plot_data <- storms %>%
  group_by(year, status) %>%
  summarise(wind = mean(wind))
#> `summarise()` has grouped output by 'year'. You can override using the
#> `.groups` argument.

gg_line_col_facet(plot_data,
        x_var = year,
        y_var = wind,
        col_var = status,
        facet_var = status)