DEPRECATED. Point ggplot that is not coloured and not facetted.
Usage
gg_point(
  data,
  x_var,
  y_var,
  text_var = NULL,
  pal = pal_viridis_mix(1),
  alpha_point = 1,
  size_point = 1.5,
  title = NULL,
  title_wrap = 80,
  subtitle = NULL,
  subtitle_wrap = 80,
  x_zero_mid = FALSE,
  x_breaks_n = 5,
  x_expand = NULL,
  x_jitter = 0,
  x_labels = NULL,
  x_rev = FALSE,
  x_title = NULL,
  x_title_wrap = 50,
  x_zero = FALSE,
  x_zero_line = NULL,
  y_zero_mid = FALSE,
  y_breaks_n = 5,
  y_expand = c(0, 0),
  y_jitter = 0,
  y_labels = scales::label_comma(),
  y_title = NULL,
  y_title_wrap = 50,
  y_zero = FALSE,
  y_zero_line = NULL,
  caption = NULL,
  caption_wrap = 80,
  theme = gg_theme(y_grid = TRUE, x_grid = TRUE),
  mobile = FALSE
)
Arguments
- data
A data frame in a structure to be plotted untransformed. Required input.
- x_var
Unquoted variable to be on the x scale (i.e. character, factor, logical, numeric, date or POSIXt). Required input.
- y_var
Unquoted numeric variable to be on the y scale. Required input.
- text_var
Unquoted variable to be used as a customised tooltip in combination with plotly::ggplotly(plot, tooltip = "text"). Defaults to NULL.
- pal
Character vector of hex codes.
- alpha_point
The opacity of the points.
- size_point
Size of points. Defaults to 1.5.
- title
Title string.
- title_wrap
Number of characters to wrap the title to. Defaults to 75.
- subtitle
Subtitle string.
- subtitle_wrap
Number of characters to wrap the subtitle to. Defaults to 100. Not applicable where mobile equals TRUE.
- x_zero_mid
For a numeric x variable, add balance to the x scale so that zero is in the centre. Defaults to FALSE.
- x_breaks_n
For a numeric or date x variable, the desired number of intervals on the x scale, as calculated by the pretty algorithm. Defaults to 5.
- x_expand
A vector of range expansion constants used to add padding to the x scale, as per the ggplot2 expand argument in ggplot2 scales functions.
- x_jitter
Amount of horizontal jitter to be added in positive and negative directions. Defaults to 0. See ggplot2::position_jitter for further information.
- x_labels
A function or named vector to modify x scale labels. Use function(x) x to keep labels untransformed.
- x_rev
For a categorical x variable, TRUE or FALSE of whether the x variable variable is reversed. Defaults to FALSE.
- x_title
X scale title string. Defaults to NULL, which converts to sentence case with spaces. Use "" if you would like no title.
- x_title_wrap
Number of characters to wrap the x title to. Defaults to 50.
- x_zero
For a numeric x variable, TRUE or FALSE of whether the minimum of the x scale is zero. Defaults to FALSE.
- x_zero_line
For a numeric x variable, TRUE or FALSE of whether to add a zero reference line to the x scale. Defaults to TRUE if there are positive and negative values in x_var. Otherwise defaults to FALSE.
- y_zero_mid
For a numeric y variable, add balance to the y scale so that zero is in the centre of the y scale.
- y_breaks_n
For a numeric or date x variable, the desired number of intervals on the x scale, as calculated by the pretty algorithm. Defaults to 5.
- y_expand
A vector of range expansion constants used to add padding to the y scale, as per the ggplot2 expand argument in ggplot2 scales functions.
- y_jitter
Amount of vertical jitter to be added in positive and negative directions. Defaults to 0.See ggplot2::position_jitter for further information.
- y_labels
A function or named vector to modify y scale labels. Use function(x) x to keep labels untransformed.
- y_title
y scale title string. Defaults to NULL, which converts to sentence case with spaces. Use "" if you would like no title.
- y_title_wrap
Number of characters to wrap the y title to. Defaults to 50.
- y_zero
For a numeric y variable, TRUE or FALSE of whether the minimum of the y scale is zero. Defaults to TRUE.
- y_zero_line
For a numeric y variable, TRUE or FALSE whether to add a zero reference line to the y scale. Defaults to TRUE if there are positive and negative values in y_var. Otherwise defaults to FALSE.
- caption
Caption title string.
- caption_wrap
Number of characters to wrap the caption to. Defaults to 80.
- theme
A ggplot2 theme.
- mobile
Whether the plot is to be displayed on a mobile device. Defaults to FALSE.
Examples
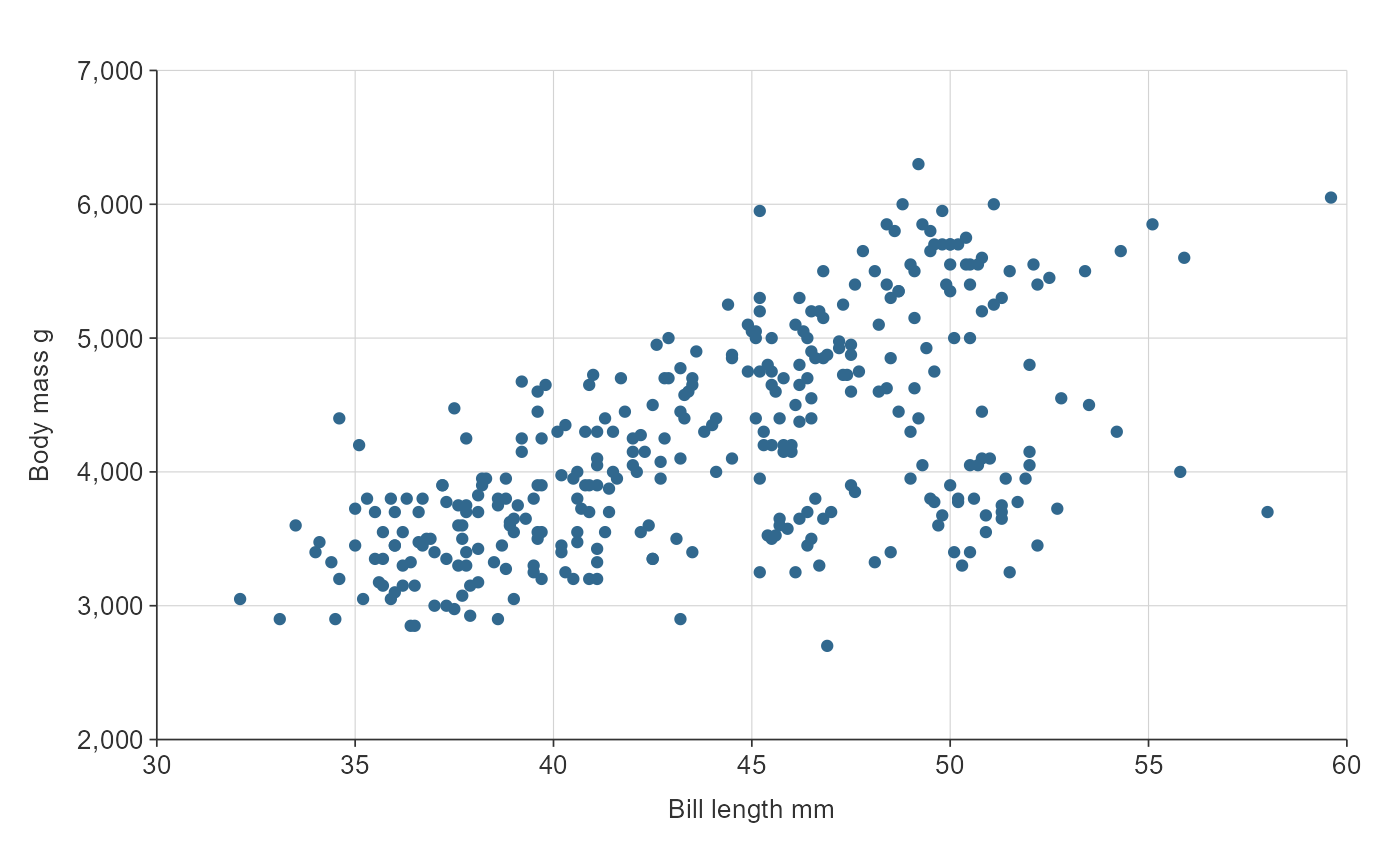
library(simplevis)
library(palmerpenguins)

gg_point(penguins,
         x_var = bill_length_mm,
         y_var = body_mass_g)