Boxplot ggplot that is not coloured and not facetted.
ggplot_box(data, x_var, y_var = NULL, group_var = NULL,
  stat = "boxplot", pal = NULL, width = 0.5, title = "[Title]",
  title_wrap = 70, subtitle = NULL, subtitle_wrap = 80,
  x_expand = NULL, x_labels = waiver(), x_pretty_n = 6,
  x_title = "[X title]", x_title_wrap = 50, y_balance = FALSE,
  y_expand = NULL, y_labels = waiver(), y_pretty_n = 5,
  y_title = "[Y title]", y_title_wrap = 50, y_trans = "identity",
  y_zero = TRUE, y_zero_line = NULL, caption = NULL,
  caption_wrap = 80, font_family = "Helvetica",
  font_size_title = NULL, font_size_body = NULL, isMobile = FALSE)
Arguments
| data | A tibble or dataframe. Required input. |
|---|---|
| x_var | Unquoted variable to be on the x axis. Required input. |
| y_var | Unquoted numeric variable to be on the y axis. Defaults to NULL. Required if stat equals "boxplot". |
| group_var | Unquoted variable to be the grouping variable Defaults to NULL. Only applicable if stat equals "boxplot". |
| stat | String of "boxplot" or "identity". Defaults to "boxplot". If identity is selected, data provided must be grouped by the x_var with ymin, lower, middle, upper, ymax variables. Note "identity" does not provide outliers. |
| pal | Character vector of hex codes. Defaults to viridis. Use the pals package to find a suitable palette. |
| width | Width of the box. Defaults to 0.5. |
| title | Title string. Defaults to "[Title]". |
| title_wrap | Number of characters to wrap the title to. Defaults to 70. Not applicable where isMobile equals TRUE. |
| subtitle | Subtitle string. Defaults to "[Subtitle]". |
| subtitle_wrap | Number of characters to wrap the subtitle to. Defaults to 80. Not applicable where isMobile equals TRUE. |
| x_expand | A vector of range expansion constants used to add some padding on the x scale. |
| x_labels | Argument to adjust the format of the x scale labels. |
| x_pretty_n | The desired number of intervals on the x axis, as calculated by the pretty algorithm. Defaults to 6. Only applicable to a x variable that is categorical or date. |
| x_title | X axis title string. Defaults to "[X title]". |
| x_title_wrap | Number of characters to wrap the x title to. Defaults to 50. Not applicable where isMobile equals TRUE. |
| y_balance | Add balance to the y axis so that zero is in the centre of the y scale. |
| y_expand | A vector of range expansion constants used to add some padding on the y scale. |
| y_labels | Argument to adjust the format of the y scale labels. |
| y_pretty_n | The desired number of intervals on the y axis, as calculated by the pretty algorithm. Defaults to 5. |
| y_title | Y axis title string. Defaults to "[Y title]". |
| y_title_wrap | Number of characters to wrap the y title to. Defaults to 50. Not applicable where isMobile equals TRUE. |
| y_trans | TRUEransformation of y-axis scale (e.g. "signed_sqrt"). Defaults to "identity", which has no transformation. |
| y_zero | TRUE or FALSE of whether the minimum of the y scale is zero. Defaults to TRUE. |
| y_zero_line | TRUE or FALSE whether to add a zero reference line to the y axis. Defaults to NULL, which is TRUE if there are positive and negative values in y_var. Otherwise it is FALSE. |
| caption | Caption title string. Defaults to NULL. |
| caption_wrap | Number of characters to wrap the caption to. Defaults to 80. Not applicable where isMobile equals TRUE. |
| font_family | Font family to use. Defaults to "Helvetica". |
| font_size_title | Font size for the title text. Defaults to 11. |
| font_size_body | Font size for all text other than the title. Defaults to 10. |
| isMobile | Whether the plot is to be displayed on a mobile device. Defaults to FALSE. If within an app with the mobileDetect function, then use isMobile = input$isMobile. |
Value
A ggplot object.
Examples
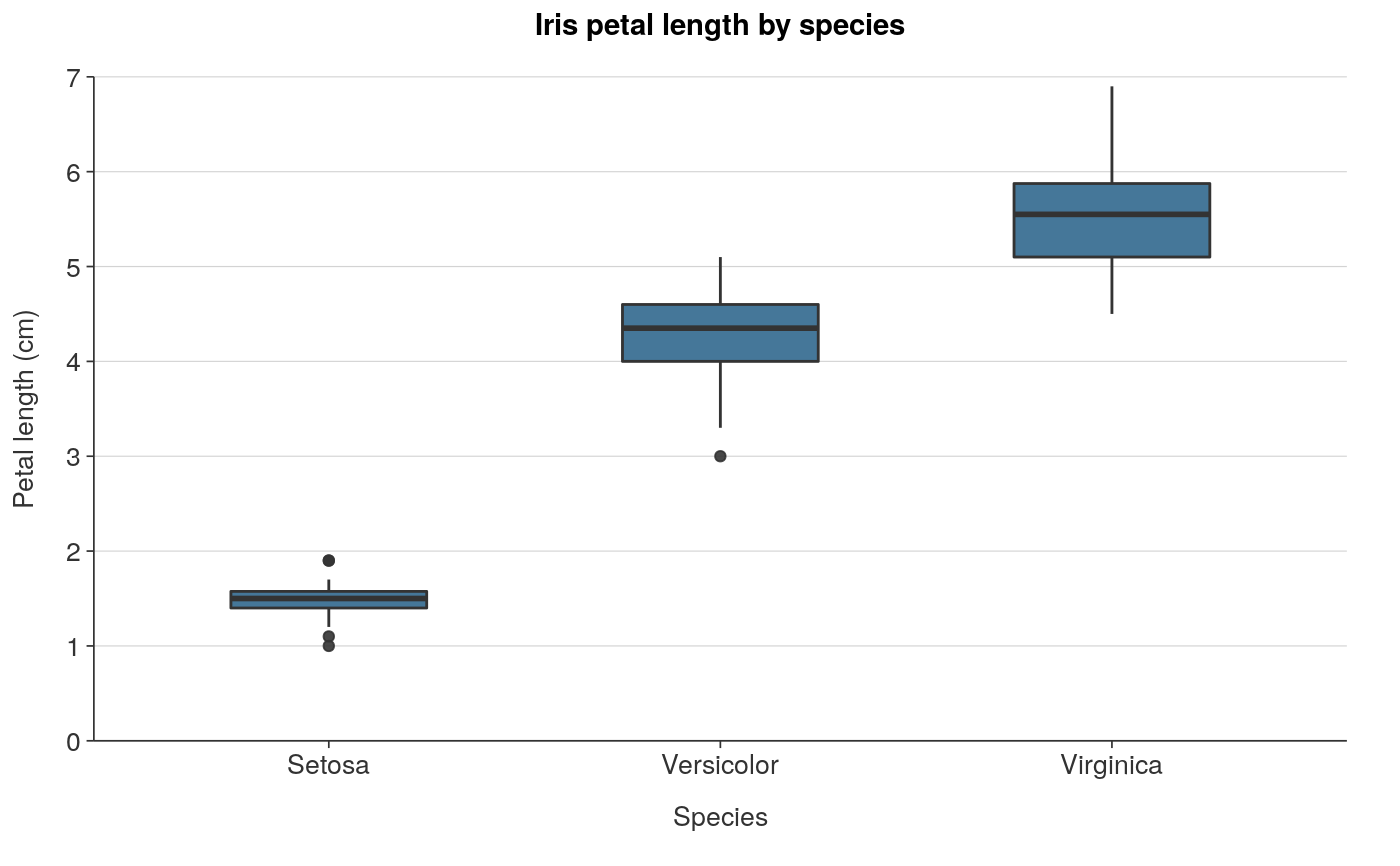
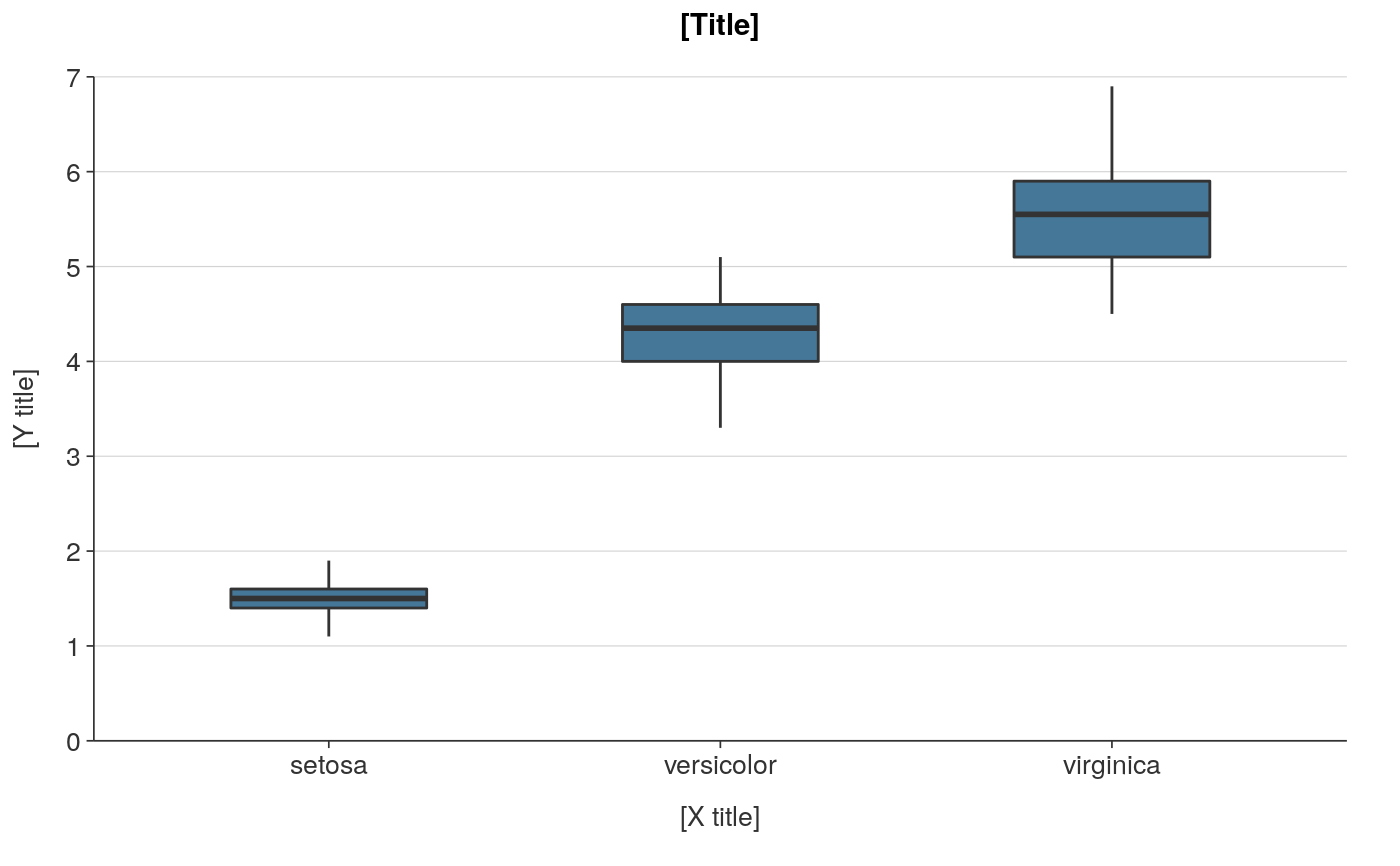
library(dplyr)#> #>#> #> #>#> #> #>plot_data <- iris %>% tibble::as_tibble() %>% mutate(Species = stringr::str_to_sentence(Species)) ggplot_box(plot_data, Species, Petal.Length, title = "Iris petal length by species", x_title = "Species", y_title = "Petal length (cm)")plot_data <- iris %>% group_by(Species) %>% summarise(boxplot_stats = list(rlang::set_names(boxplot.stats(Petal.Length)$stats, c('ymin','lower','middle','upper','ymax')))) %>% tidyr::unnest_wider(boxplot_stats) ggplot_box(plot_data, Species, Petal.Length, stat = "identity")