Scatter ggplot that is not coloured and not facetted.
ggplot_scatter(data, x_var, y_var, tip_var = NULL, size = 1,
  pal = NULL, x_zero = TRUE, x_zero_line = FALSE,
  x_trans = "identity", x_labels = waiver(), x_pretty_n = 6,
  x_expand = NULL, y_zero = TRUE, y_zero_line = FALSE,
  y_trans = "identity", y_labels = waiver(), y_pretty_n = 5,
  y_expand = NULL, title = "[Title]", subtitle = NULL,
  x_title = "[X title]", y_title = "[Y title]", caption = NULL,
  font_family = "Helvetica", font_size_title = NULL,
  font_size_body = NULL, title_wrap = 70, subtitle_wrap = 80,
  x_title_wrap = 50, y_title_wrap = 50, caption_wrap = 80,
  isMobile = FALSE)
Arguments
| data | An ungrouped summarised tibble or dataframe. Required input. |
|---|---|
| x_var | Unquoted numeric variable to be on the x axis. Required input. |
| y_var | Unquoted numeric variable to be on the y axis. Required input. |
| tip_var | Unquoted variable to be used as a customised tooltip in combination with plotly::ggplotly(plot). Defaults to NULL. |
| size | Size of points. Defaults to 1. |
| pal | Character vector of hex codes. Defaults to NULL, which selects a default palette. |
| x_zero | TRUE or FALSE whether the minimum of the x scale is zero. Defaults to TRUE. |
| x_zero_line | TRUE or FALSE whether to add a zero line in for when values are above and below zero. Defaults to TRUE. |
| x_trans | A string specifying a transformation for the x scale. Defaults to "identity". |
| x_labels | Argument to adjust the format of the x scale labels. |
| x_pretty_n | The desired number of intervals on the x axis, as calculated by the pretty algorithm. Defaults to 6. Not applicable where isMobile equals TRUE. |
| x_expand | A vector of range expansion constants used to add some padding on the x scale. |
| y_zero | TRUE or FALSE whether the minimum of the y scale is zero. Defaults to TRUE. |
| y_zero_line | TRUE or FALSE whether to add a zero line in for when values are above and below zero. Defaults to TRUE. |
| y_trans | A string specifying a transformation for the y scale. Defaults to "identity". |
| y_labels | Argument to adjust the format of the y scale labels. |
| y_pretty_n | The desired number of intervals on the y axis, as calculated by the pretty algorithm. Defaults to 5. |
| y_expand | A vector of range expansion constants used to add some padding on the y scale. |
| title | Title string. Defaults to "[Title]". |
| subtitle | Subtitle string. Defaults to "[Subtitle]". |
| x_title | X axis title string. Defaults to "[X title]". |
| y_title | Y axis title string. Defaults to "[Y title]". |
| caption | Caption title string. Defaults to NULL. |
| font_family | Font family to use. Defaults to "Helvetica". |
| font_size_title | Font size for the title text. Defaults to 11. |
| font_size_body | Font size for all text other than the title. Defaults to 10. |
| title_wrap | Number of characters to wrap the title to. Defaults to 70. Not applicable where isMobile equals TRUE. |
| subtitle_wrap | Number of characters to wrap the subtitle to. Defaults to 80. Not applicable where isMobile equals TRUE. |
| x_title_wrap | Number of characters to wrap the x title to. Defaults to 50. Not applicable where isMobile equals TRUE. |
| y_title_wrap | Number of characters to wrap the y title to. Defaults to 50. Not applicable where isMobile equals TRUE. |
| caption_wrap | Number of characters to wrap the caption to. Defaults to 80. Not applicable where isMobile equals TRUE. |
| isMobile | Whether the plot is to be displayed on a mobile device. Defaults to FALSE. If within an app with the mobileDetect function, then use isMobile = input$isMobile. |
Value
A ggplot object.
Examples
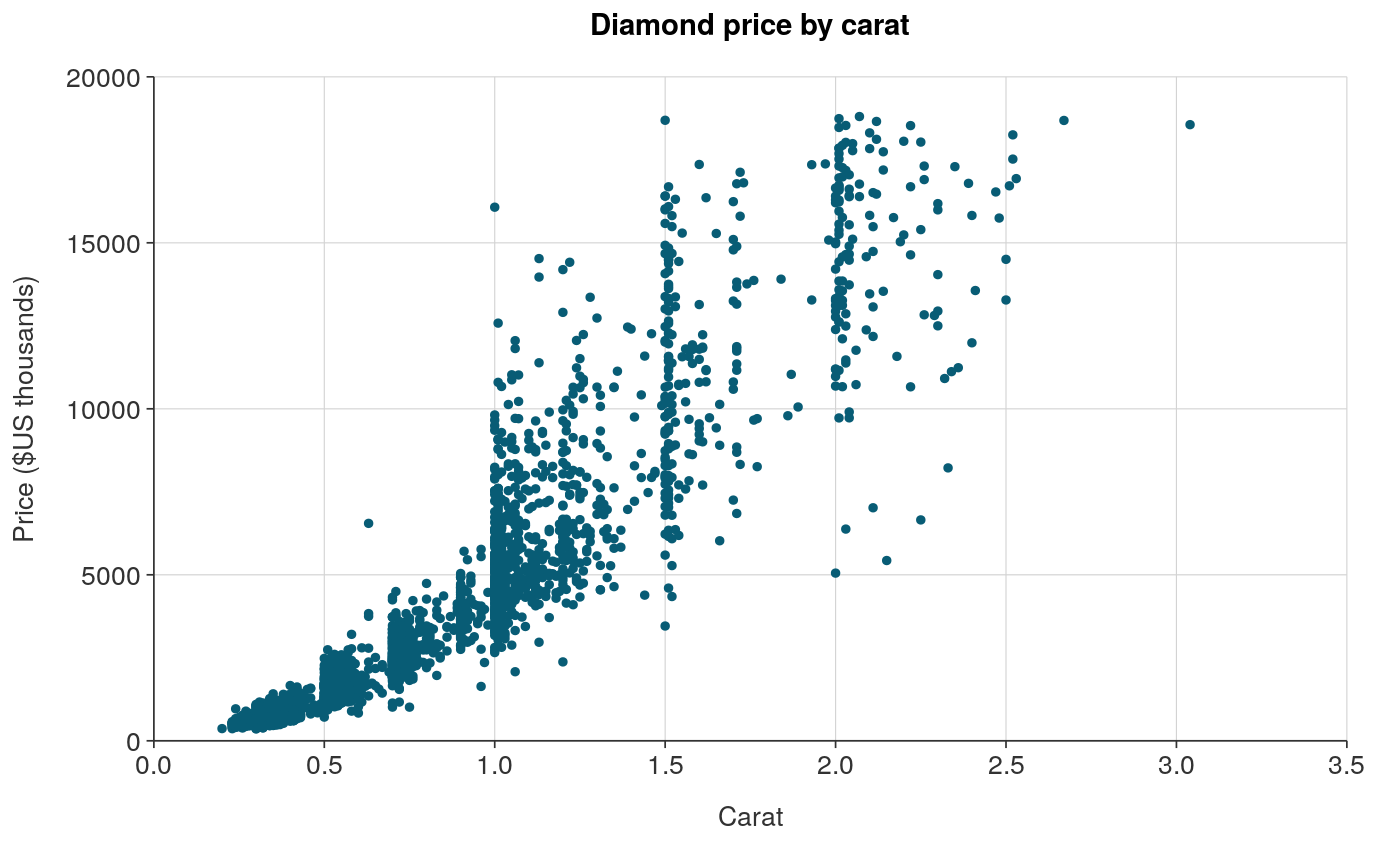
library(dplyr)

plot_data <- slice_sample(ggplot2::diamonds, prop = 0.05)

ggplot_scatter(plot_data, carat, price,
   title = "Diamond price by carat",
   x_title = "Carat",
   y_title = "Price ($US thousands)")