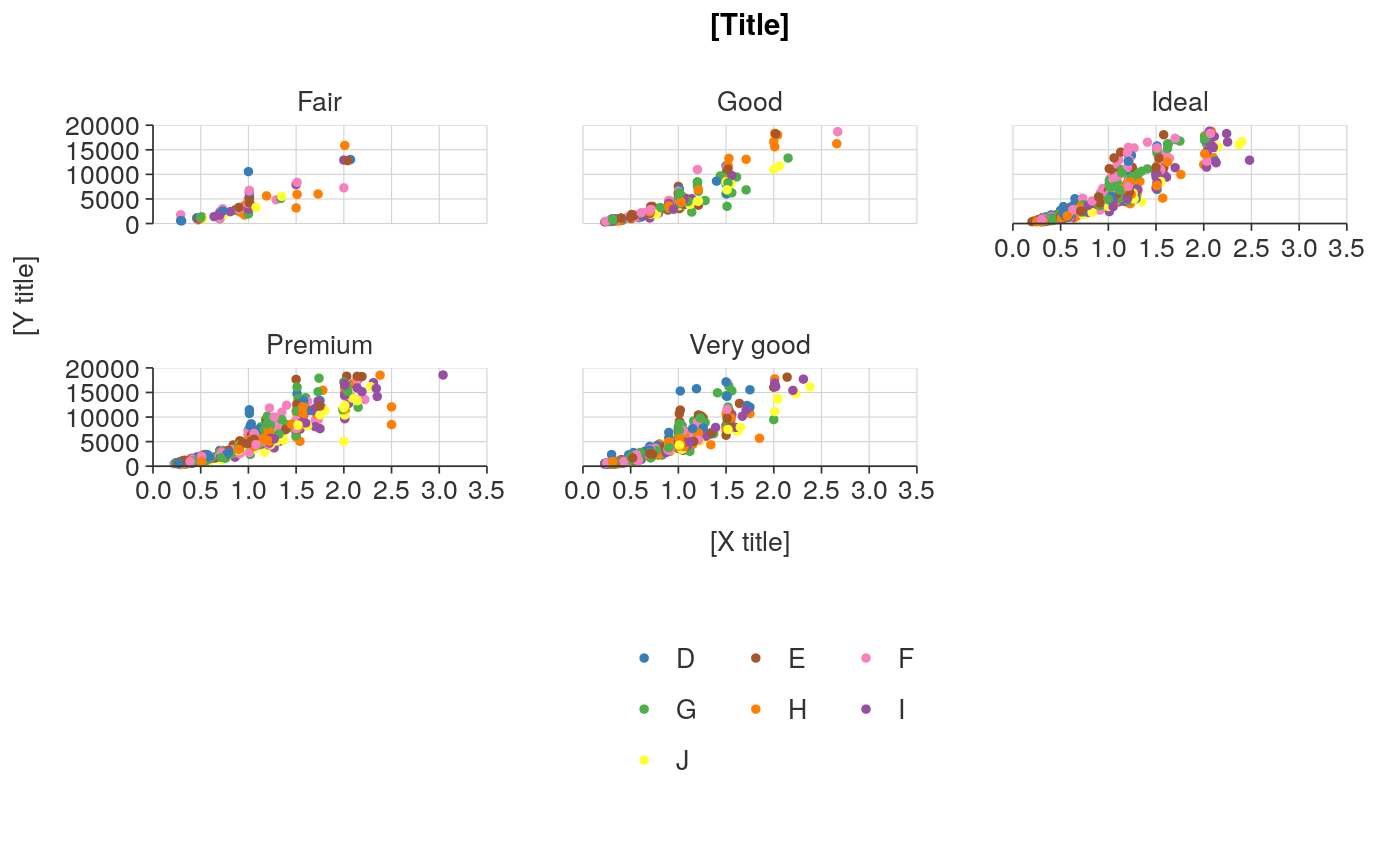
Scatter ggplot that is coloured and facetted.
Source:R/ggplot_scatter_fun.R
ggplot_scatter_col_facet.RdScatter ggplot that is coloured and facetted.
ggplot_scatter_col_facet(data, x_var, y_var, col_var, facet_var,
  tip_var = NULL, col_method = NULL, col_cuts = NULL,
  quantile_by_facet = TRUE, size = 1, pal = NULL, pal_rev = FALSE,
  x_zero = TRUE, x_zero_line = FALSE, x_trans = "identity",
  x_labels = waiver(), x_pretty_n = 5, x_expand = NULL,
  y_zero = TRUE, y_zero_line = FALSE, y_trans = "identity",
  y_labels = waiver(), y_pretty_n = 5, y_expand = NULL,
  facet_scales = "fixed", facet_nrow = NULL, legend_ncol = 3,
  legend_digits = 1, title = "[Title]", subtitle = NULL,
  x_title = "[X title]", y_title = "[Y title]", col_title = "",
  caption = NULL, legend_labels = NULL, font_family = "Helvetica",
  font_size_title = NULL, font_size_body = NULL, title_wrap = 70,
  subtitle_wrap = 80, x_title_wrap = 50, y_title_wrap = 50,
  wrap_col_title = 25, caption_wrap = 80)
Arguments
| data | An ungrouped summarised tibble or dataframe. Required input. |
|---|---|
| x_var | Unquoted numeric variable to be on the x axis. Required input. |
| y_var | Unquoted numeric variable to be on the y axis. Required input. |
| col_var | Unquoted variable for points to be coloured by. Required input. |
| facet_var | Unquoted categorical variable to facet the data by. Required input. |
| tip_var | Unquoted variable to be used as a customised tooltip in combination with plotly::ggplotly(plot). Defaults to NULL. |
| col_method | The method of colouring features, either "bin", "quantile" or "category." If numeric, defaults to "quantile". |
| col_cuts | A vector of cuts to colour a numeric variable. If "bin" is selected, the first number in the vector should be either -Inf or 0, and the final number Inf. If "quantile" is selected, the first number in the vector should be 0 and the final number should be 1. Defaults to quartiles. |
| quantile_by_facet | TRUE of FALSE whether quantiles should be calculated for each group of the facet variable. Defaults to TRUE. |
| size | Size of points. Defaults to 1. |
| pal | Character vector of hex codes. Defaults to NULL, which selects the Stats NZ palette or viridis. |
| pal_rev | Reverses the palette. Defaults to FALSE. |
| x_zero | TRUE or FALSE whether the minimum of the x scale is zero. Defaults to TRUE. |
| x_zero_line | TRUE or FALSE whether to add a zero line in for when values are above and below zero. Defaults to TRUE. |
| x_trans | A string specifying a transformation for the x scale. Defaults to "identity". |
| x_labels | Argument to adjust the format of the x scale labels. |
| x_pretty_n | The desired number of intervals on the x axis, as calculated by the pretty algorithm. Defaults to 5. |
| x_expand | A vector of range expansion constants used to add some padding on the x scale. |
| y_zero | TRUE or FALSE whether the minimum of the y scale is zero. Defaults to TRUE. |
| y_zero_line | TRUE or FALSE whether to add a zero line in for when values are above and below zero. Defaults to TRUE. |
| y_trans | A string specifying a transformation for the y scale. Defaults to "identity". |
| y_labels | Argument to adjust the format of the y scale labels. |
| y_pretty_n | The desired number of intervals on the y axis, as calculated by the pretty algorithm. Defaults to 5. |
| y_expand | A vector of range expansion constants used to add some padding on the y scale. |
| facet_scales | Whether facet_scales should be "fixed" across facets, "free" in both directions, or free in just one direction (i.e. "free_x" or "free_y"). Defaults to "fixed". |
| facet_nrow | The number of rows of facetted plots. Defaults to NULL, which generally chooses 2 rows. |
| legend_ncol | The number of columns in the legend. |
| legend_digits | Select the appropriate number of decimal places for numeric variable auto legend labels. Defaults to 1. |
| title | Title string. Defaults to "[Title]". |
| subtitle | Subtitle string. Defaults to "[Subtitle]". |
| x_title | X axis title string. Defaults to "[X title]". |
| y_title | Y axis title string. Defaults to "[Y title]". |
| col_title | Colour title string for the legend. Defaults to NULL. |
| caption | Caption title string. Defaults to NULL. |
| legend_labels | A vector of manual legend label values. Defaults to NULL, which results in automatic labels. |
| font_family | Font family to use. Defaults to "Helvetica". |
| font_size_title | Font size for the title text. Defaults to 11. |
| font_size_body | Font size for all text other than the title. Defaults to 10. |
| title_wrap | Number of characters to wrap the title to. Defaults to 70. |
| subtitle_wrap | Number of characters to wrap the subtitle to. Defaults to 80. |
| x_title_wrap | Number of characters to wrap the x title to. Defaults to 50. |
| y_title_wrap | Number of characters to wrap the y title to. Defaults to 50. |
| wrap_col_title | Number of characters to wrap the colour title to. Defaults to 25. |
| caption_wrap | Number of characters to wrap the caption to. Defaults to 80. |
Value
A ggplot object.
Examples
library(dplyr)

plot_data <- ggplot2::diamonds %>%
  sample_frac(0.05) %>%
  mutate(cut = stringr::str_to_sentence(cut))

ggplot_scatter_col_facet(plot_data, carat, price, color, cut)