Working with quoted inputs
In {shiny}, it is often
easier to work with quoted variables. For {ggplot2} wrapper function,
wrap the variables in !!sym, as shown below.
gg_point_col(penguins,
             x_var = !!sym("bill_length_mm"),
             y_var = !!sym("body_mass_g"),
             col_var = !!sym("species"))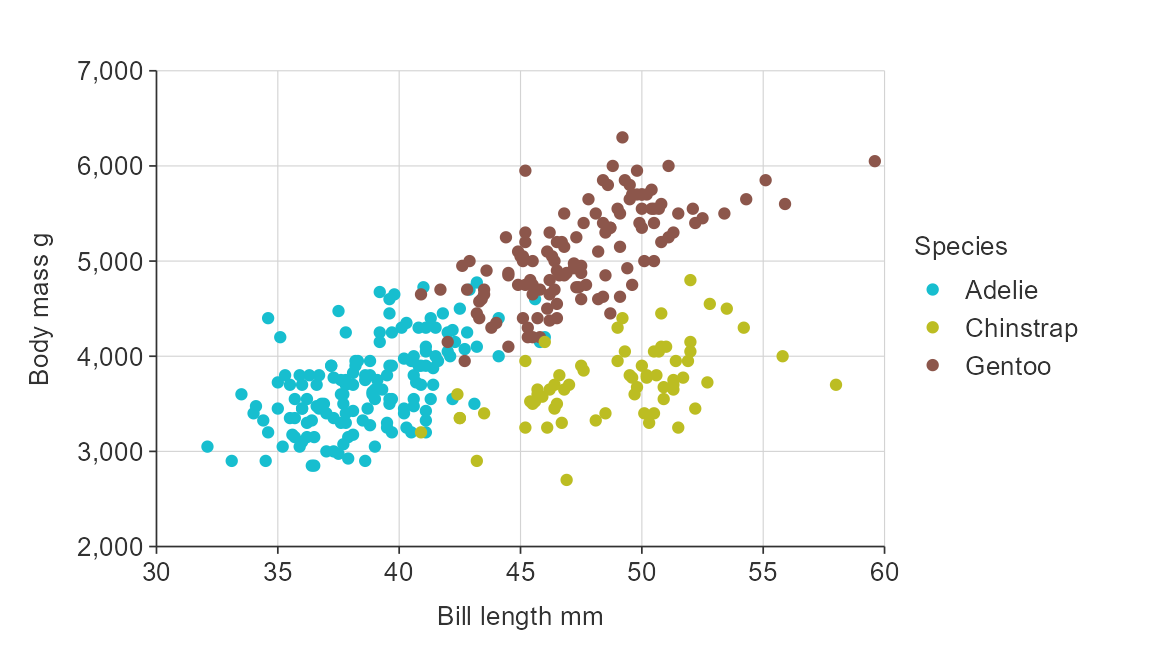
Mobile friendly apps
A difficulty with shiny is making shiny apps that display graphs that work on mobile phones in portrait mode.
They often look unreadable (in portrait), as:
- titles neeed to start from the far left of the plot, and be left-aligned
- titles need to be wrapped
- x scale needs the minimum of labels to not look clutterred
- legends need to be on the bottom
- font sizes need to be appropriate
{simplevis} provides mobile support for plots through a
mobile argument, which makes the above changes.
plot_data <- storms %>%
  group_by(year, status) %>%
  summarise(wind = mean(wind))

gg_point_col(penguins,
             x_var = bill_length_mm,
             y_var = body_mass_g,
             col_var = species,
             title = "Adult penguin mass by bill length and species",
             mobile = TRUE)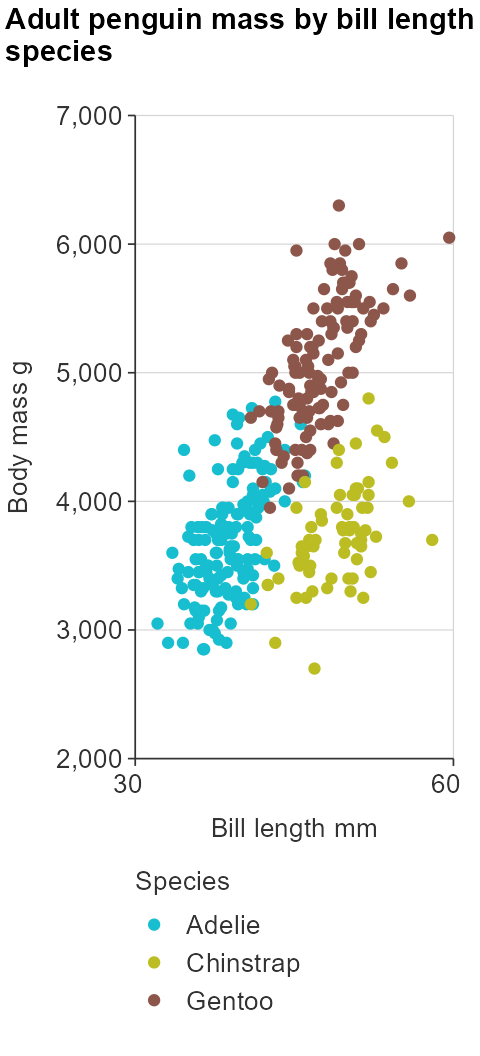
Gervasio Marchand describes a method here to identify whether users are on a mobile device. This method can be used in combination with the method described above to provide a mobile friendly plot to mobile users and a normal plot to non-mobile users.