Boxplot ggplot that is coloured
ggplot_boxplot_col(
  data,
  x_var,
  y_var = NULL,
  col_var,
  stat = "boxplot",
  pal = NULL,
  pal_rev = FALSE,
  width = 0.5,
  alpha = 1,
  size_line = 0.5,
  size_point = 1,
  title = NULL,
  title_wrap = 70,
  subtitle = NULL,
  subtitle_wrap = 80,
  x_balance = FALSE,
  x_labels = waiver(),
  x_pretty_n = 6,
  x_expand = NULL,
  x_title = NULL,
  x_title_wrap = 50,
  x_zero = FALSE,
  x_zero_line = NULL,
  y_balance = FALSE,
  y_expand = NULL,
  y_labels = waiver(),
  y_pretty_n = 5,
  x_rev = FALSE,
  y_title = NULL,
  y_title_wrap = 50,
  y_trans = "identity",
  y_zero = FALSE,
  y_zero_line = NULL,
  col_labels = waiver(),
  col_legend_ncol = NULL,
  col_legend_nrow = NULL,
  col_na = TRUE,
  col_rev = FALSE,
  col_title = NULL,
  col_title_wrap = 25,
  caption = NULL,
  caption_wrap = 80,
  font_family = "Helvetica",
  font_size_title = NULL,
  font_size_body = NULL,
  mobile = FALSE
)
Arguments
| data | A tibble or dataframe. Required input. |
|---|---|
| x_var | Unquoted numeric, date or categorical variable to be on the x axis. Required input. |
| y_var | Unquoted numeric variable to be on the y axis. Defaults to NULL. Required if stat equals "boxplot". |
| col_var | Unquoted categorical variable to colour the fill of the boxes. Required input. |
| stat | String of "boxplot" or "identity". Defaults to "boxplot". If identity is selected, data provided must be grouped by the x_var with ymin, lower, middle, upper, ymax variables. Note "identity" does not provide outliers. |
| pal | Character vector of hex codes. Defaults to viridis. Use the pals package to find a suitable palette. |
| pal_rev | Reverses the palette. Defaults to FALSE. |
| width | Width of the box. Defaults to 0.5. |
| alpha | The alpha of the fill. Defaults to 1. |
| size_line | The size of the outlines of boxplots. Defaults to 0.5. |
| size_point | The size of the outliers. Defaults to 1. |
| title | Title string. Defaults to NULL. |
| title_wrap | Number of characters to wrap the title to. Defaults to 70. Not applicable where mobile equals TRUE. |
| subtitle | Subtitle string. Defaults to "[Subtitle]". |
| subtitle_wrap | Number of characters to wrap the subtitle to. Defaults to 80. Not applicable where mobile equals TRUE. |
| x_balance | For a numeric x variable, add balance to the x scale so that zero is in the centre. Defaults to FALSE. |
| x_labels | Adjust the x scale labels through a function that takes the breaks as input and returns labels as output. |
| x_pretty_n | For a numeric or date x variable, the desired number of intervals on the x scale, as calculated by the pretty algorithm. Defaults to 6. |
| x_expand | Adjust the vector of range expansion constants used to add some padding on the x scale. |
| x_title | X scale title string. Defaults to NULL, which converts to sentence case with spaces. Use "" if you would like no title. |
| x_title_wrap | Number of characters to wrap the x title to. Defaults to 50. |
| x_zero | For a numeric x variable, TRUE or FALSE of whether the minimum of the x scale is zero. Defaults to FALSE. |
| x_zero_line | For a numeric x variable, TRUE or FALSE of whether to add a zero reference line to the x scale. Defaults to TRUE if there are positive and negative values in x_var. Otherwise defaults to FALSE. |
| y_balance | For a numeric y variable, add balance to the y scale so that zero is in the centre of the y scale. |
| y_expand | Adjust the vector of range expansion constants used to add some padding on the y scale. |
| y_labels | Adjust the y scale labels through a function that takes the breaks as input and returns labels as output. |
| y_pretty_n | For a numeric or date x variable, the desired number of intervals on the x scale, as calculated by the pretty algorithm. Defaults to 5. |
| x_rev | For a categorical x variable, TRUE or FALSE of whether the x variable variable is reversed. Defaults to FALSE. |
| y_title | y scale title string. Defaults to NULL, which converts to sentence case with spaces. Use "" if you would like no title. |
| y_title_wrap | Number of characters to wrap the y title to. Defaults to 50. |
| y_trans | For a numeric y variable, a string specifying a transformation for the y scale, such as "log10" or "sqrt". Defaults to "identity". |
| y_zero | For a numeric y variable, TRUE or FALSE of whether the minimum of the y scale is zero. Defaults to TRUE. |
| y_zero_line | For a numeric y variable, TRUE or FALSE whether to add a zero reference line to the y scale. Defaults to TRUE if there are positive and negative values in y_var. Otherwise defaults to FALSE. |
| col_labels | Adjust the colour scale labels through a vector. |
| col_legend_ncol | The number of columns in the legend. Defaults to 1. |
| col_legend_nrow | The number of rows in the legend. |
| col_na | TRUE or FALSE of whether to show NA values of the colour variable. Defaults to TRUE. |
| col_rev | TRUE or FALSE of whether the colour scale is reversed. Defaults to FALSE. Defaults to FALSE. |
| col_title | Colour title string for the legend. Defaults to NULL, which converts to sentence case with spaces. Use "" if you would like no title. |
| col_title_wrap | Number of characters to wrap the colour title to. Defaults to 25. Not applicable where mobile equals TRUE. |
| caption | Caption title string. Defaults to NULL. |
| caption_wrap | Number of characters to wrap the caption to. Defaults to 80. Not applicable where mobile equals TRUE. |
| font_family | Font family to use. Defaults to "Helvetica". |
| font_size_title | Font size for the title text. Defaults to 11. |
| font_size_body | Font size for all text other than the title. Defaults to 10. |
| mobile | Whether the plot is to be displayed on a mobile device. Defaults to FALSE. If within an app with the mobileDetect function, then use mobile = input$isMobile. |
Value
A ggplot object.
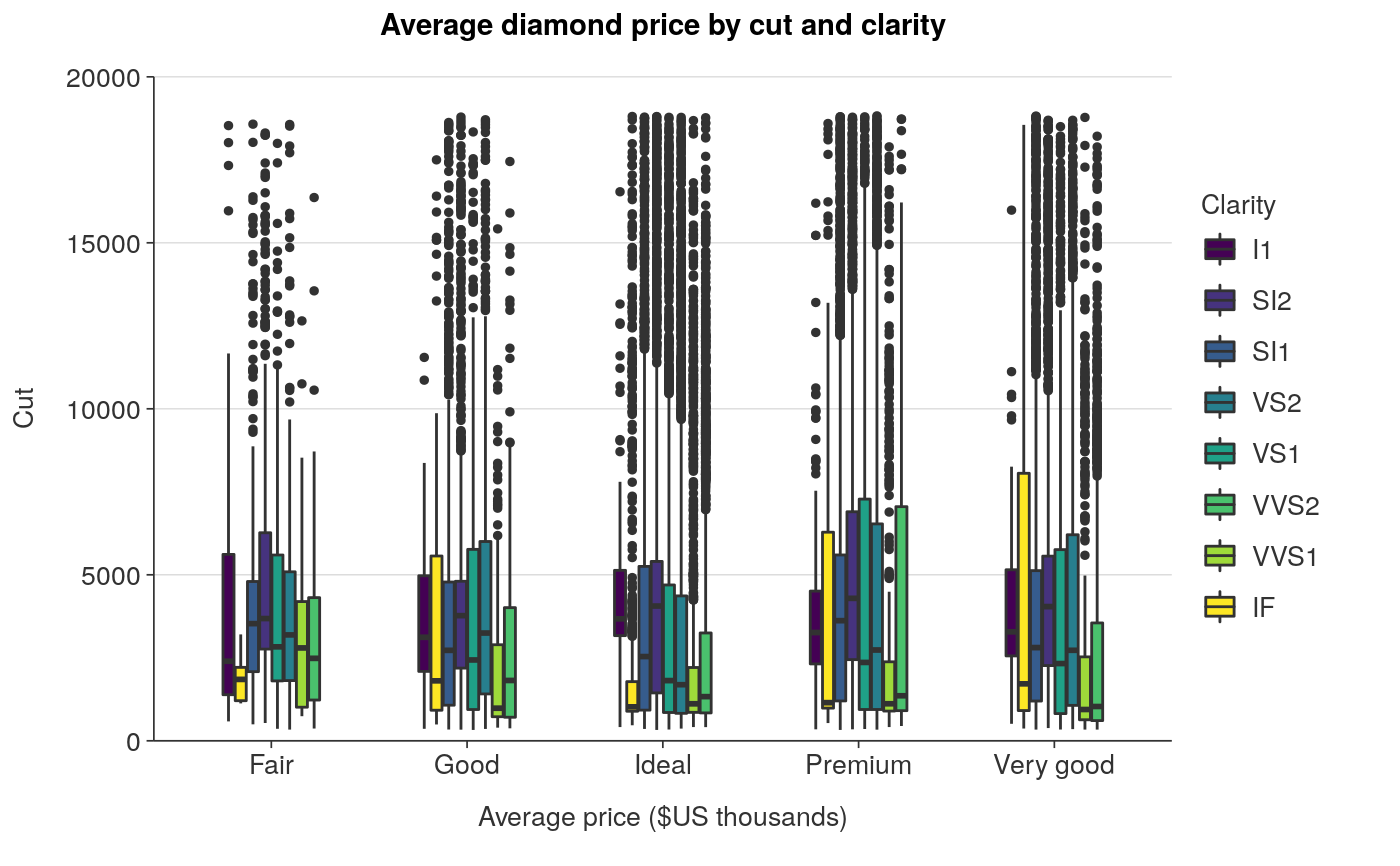
Examples
library(dplyr) plot_data <- ggplot2::diamonds %>% mutate(cut = stringr::str_to_sentence(cut)) plot <- ggplot_boxplot_col(plot_data, cut, price, clarity, title = "Average diamond price by cut and clarity", x_title = "Average price ($US thousands)", y_title = "Cut") plot#> Warning: 'layout' objects don't have these attributes: 'boxmode' #> Valid attributes include: #> 'font', 'title', 'uniformtext', 'autosize', 'width', 'height', 'margin', 'computed', 'paper_bgcolor', 'plot_bgcolor', 'separators', 'hidesources', 'showlegend', 'colorway', 'datarevision', 'uirevision', 'editrevision', 'selectionrevision', 'template', 'modebar', 'newshape', 'activeshape', 'meta', 'transition', '_deprecated', 'clickmode', 'dragmode', 'hovermode', 'hoverdistance', 'spikedistance', 'hoverlabel', 'selectdirection', 'grid', 'calendar', 'xaxis', 'yaxis', 'ternary', 'scene', 'geo', 'mapbox', 'polar', 'radialaxis', 'angularaxis', 'direction', 'orientation', 'editType', 'legend', 'annotations', 'shapes', 'images', 'updatemenus', 'sliders', 'colorscale', 'coloraxis', 'metasrc', 'barmode', 'bargap', 'mapType'#> Warning: 'layout' objects don't have these attributes: 'boxmode' #> Valid attributes include: #> 'font', 'title', 'uniformtext', 'autosize', 'width', 'height', 'margin', 'computed', 'paper_bgcolor', 'plot_bgcolor', 'separators', 'hidesources', 'showlegend', 'colorway', 'datarevision', 'uirevision', 'editrevision', 'selectionrevision', 'template', 'modebar', 'newshape', 'activeshape', 'meta', 'transition', '_deprecated', 'clickmode', 'dragmode', 'hovermode', 'hoverdistance', 'spikedistance', 'hoverlabel', 'selectdirection', 'grid', 'calendar', 'xaxis', 'yaxis', 'ternary', 'scene', 'geo', 'mapbox', 'polar', 'radialaxis', 'angularaxis', 'direction', 'orientation', 'editType', 'legend', 'annotations', 'shapes', 'images', 'updatemenus', 'sliders', 'colorscale', 'coloraxis', 'metasrc', 'barmode', 'bargap', 'mapType'