Horizontal bar ggplot that is coloured, but not facetted.
ggplot_hbar_col(
  data,
  x_var,
  y_var,
  col_var,
  text_var = NULL,
  position = "stack",
  pal = NULL,
  pal_rev = FALSE,
  width = 0.75,
  alpha = 1,
  size_line = 0.5,
  title = NULL,
  title_wrap = 70,
  subtitle = NULL,
  subtitle_wrap = 80,
  x_balance = FALSE,
  x_expand = NULL,
  x_labels = waiver(),
  x_pretty_n = 5,
  x_title = NULL,
  x_title_wrap = 50,
  x_trans = "identity",
  x_zero = TRUE,
  x_zero_line = NULL,
  y_balance = FALSE,
  y_expand = NULL,
  y_labels = waiver(),
  y_pretty_n = 6,
  y_reorder = FALSE,
  y_rev = FALSE,
  y_title = NULL,
  y_title_wrap = 50,
  y_zero = FALSE,
  y_zero_line = NULL,
  col_labels = waiver(),
  col_legend_ncol = NULL,
  col_legend_nrow = NULL,
  col_na = TRUE,
  col_rev = FALSE,
  col_title = NULL,
  col_title_wrap = 25,
  caption = NULL,
  caption_wrap = 80,
  font_family = "Helvetica",
  font_size_title = NULL,
  font_size_body = NULL,
  mobile = FALSE
)
Arguments
| data | A tibble or dataframe. Required input. |
|---|---|
| x_var | Unquoted numeric variable to be on the y scale. Required input. |
| y_var | Unquoted numeric, date or categorical variable to be on the x scale. Required input. |
| col_var | Unquoted categorical variable to colour the bars. Required input. |
| text_var | Unquoted variable to be used as a customised tooltip in combination with plotly::ggplotly(plot, tooltip = "text"). Defaults to NULL. |
| position | Whether bars are positioned by "stack" or "dodge". Defaults to "stack". |
| pal | Character vector of hex codes. Defaults to NULL, which selects a default palette. |
| pal_rev | Reverses the palette. Defaults to FALSE. |
| width | Width of bars. Defaults to 0.75. |
| alpha | The alpha of the fill. Defaults to 1. |
| size_line | The size of the outlines of bars. |
| title | Title string. Defaults to NULL. |
| title_wrap | Number of characters to wrap the title to. Defaults to 70. |
| subtitle | Subtitle string. Defaults to [Subtitle]. |
| subtitle_wrap | Number of characters to wrap the subtitle to. Defaults to 80. |
| x_balance | For a numeric x variable, add balance to the x scale so that zero is in the centre of the x scale. |
| x_expand | Adjust the vector of range expansion constants used to add some padding on the x scale. |
| x_labels | Adjust the x scale labels through a function that takes the breaks as input and returns labels as output. |
| x_pretty_n | For a numeric or date x variable, the desired number of intervals on the x scale, as calculated by the pretty algorithm. Defaults to 5. |
| x_title | X scale title string. Defaults to NULL, which converts to sentence case with spaces. Use "" if you would like no title. |
| x_title_wrap | Number of characters to wrap the x title to. Defaults to 50. |
| x_trans | For a numeric x variable, a string specifying a transformation for the x scale, such as "log10" or "sqrt". Defaults to "identity". |
| x_zero | For a numeric x variable, TRUE or FALSE of whether the minimum of the x scale is zero. Defaults to TRUE. |
| x_zero_line | For a numeric x variable, TRUE or FALSE whether to add a zero reference line to the x scale. Defaults to TRUE if there are positive and negative values in x_var. Otherwise defaults to FALSE. |
| y_balance | For a numeric y variable, add balance to the y scale so that zero is in the centre. Defaults to FALSE. |
| y_expand | Adjust the vector of range expansion constants used to add some padding on the y scale. |
| y_labels | Adjust the y scale labels through a function that takes the breaks as input and returns labels as output. |
| y_pretty_n | For a numeric or date y variable, the desired number of intervals on the y scale, as calculated by the pretty algorithm. Defaults to 6. |
| y_reorder | For a categorical y variable, TRUE or FALSE of whether the y variable variable is to be reordered by the y variable. Defaults to FALSE. |
| y_rev | TRUE or FALSE of whether the y variable variable is reversed. Defaults to FALSE. |
| y_title | y scale title string. Defaults to NULL, which converts to sentence case with spaces. Use "" if you would like no title. |
| y_title_wrap | Number of characters to wrap the y title to. Defaults to 50. |
| y_zero | For a numeric y variable, TRUE or FALSE of whether the minimum of the y scale is zero. Defaults to FALSE. |
| y_zero_line | For a numeric y variable, TRUE or FALSE of whether to add a zero reference line to the y scale. Defaults to TRUE if there are positive and negative values in y_var. Otherwise defaults to FALSE. |
| col_labels | Adjust the colour scale labels through a vector. |
| col_legend_ncol | The number of columns in the legend. |
| col_legend_nrow | The number of rows in the legend. |
| col_na | TRUE or FALSE of whether to show NA values of the colour variable. Defaults to TRUE. |
| col_rev | TRUE or FALSE of whether the colour scale is reversed. Defaults to FALSE. Defaults to FALSE. |
| col_title | Colour title string for the legend. Defaults to NULL, which converts to sentence case with spaces. Use "" if you would like no title. |
| col_title_wrap | Number of characters to wrap the colour title to. Defaults to 25. |
| caption | Caption title string. Defaults to NULL. |
| caption_wrap | Number of characters to wrap the caption to. Defaults to 80. |
| font_family | Font family to use. Defaults to "Helvetica". |
| font_size_title | Font size for the title text. Defaults to 11. |
| font_size_body | Font size for all text other than the title. Defaults to 10. |
| mobile | Whether the plot is to be displayed on a mobile device. Defaults to FALSE. If within an app with the mobileDetect function, then use mobile = input$isMobile. |
Value
A ggplot object.
Examples
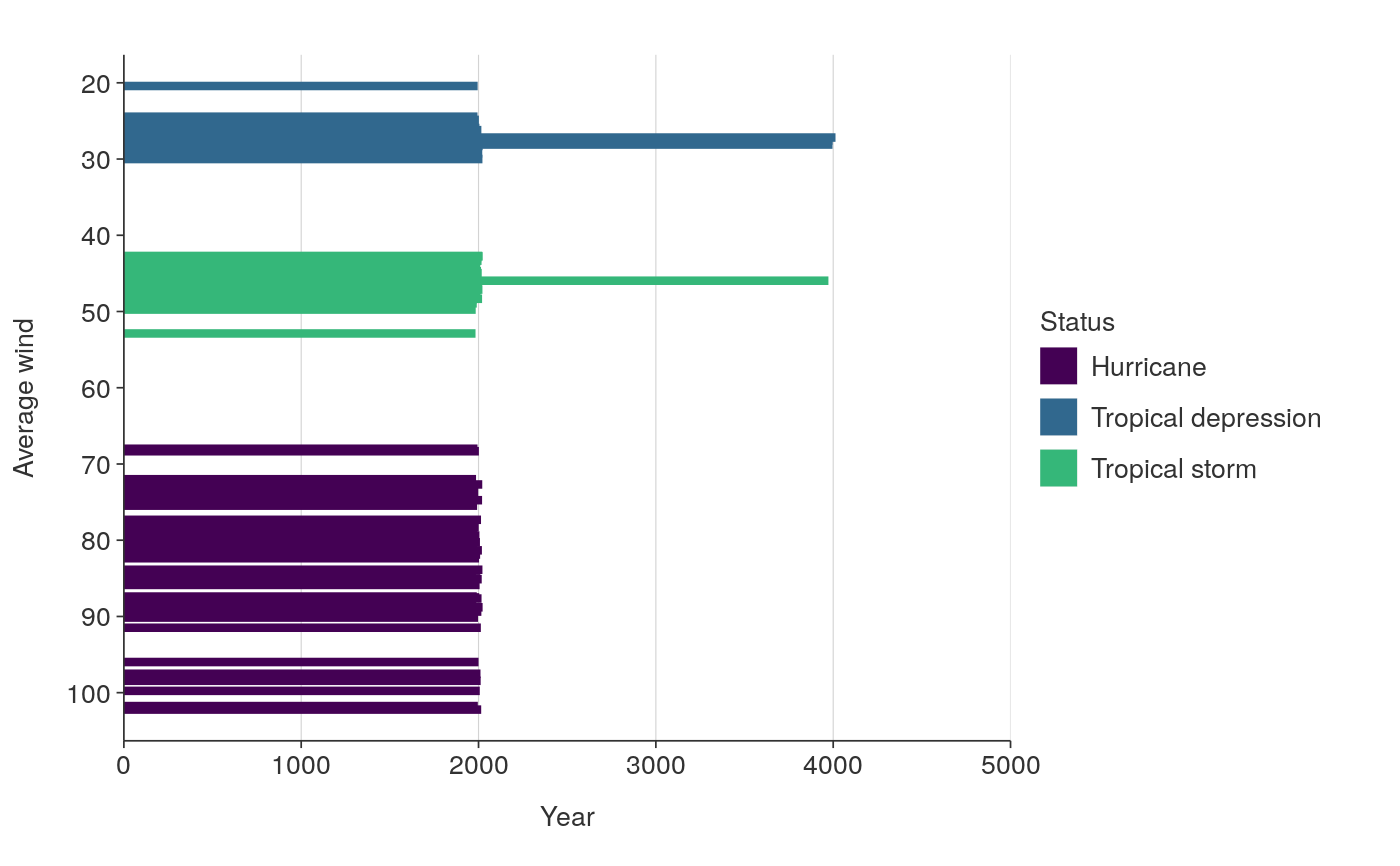
library(dplyr) plot_data <- storms %>% mutate(status = stringr::str_to_sentence(status)) %>% group_by(year, status) %>% summarise(average_wind = round(mean(wind), 2))#>ggplot_hbar_col(plot_data, year, average_wind, status)#> Warning: position_stack requires non-overlapping x intervals