Point ggplot that is coloured and facetted.
ggplot_point_col_facet(
  data,
  x_var,
  y_var,
  col_var,
  facet_var,
  text_var = NULL,
  size_point = 1,
  pal = NULL,
  pal_rev = FALSE,
  title = NULL,
  title_wrap = 70,
  subtitle = NULL,
  subtitle_wrap = 80,
  x_balance = FALSE,
  x_expand = NULL,
  x_labels = waiver(),
  x_pretty_n = 5,
  x_rev = FALSE,
  x_title = NULL,
  x_title_wrap = 50,
  x_trans = "identity",
  x_zero = FALSE,
  x_zero_line = NULL,
  y_balance = FALSE,
  y_expand = NULL,
  y_labels = waiver(),
  y_pretty_n = 5,
  y_title = NULL,
  y_title_wrap = 50,
  y_trans = "identity",
  y_zero = FALSE,
  y_zero_line = NULL,
  col_cuts = NULL,
  col_labels_dp = 1,
  col_legend_ncol = NULL,
  col_legend_nrow = NULL,
  col_method = NULL,
  col_na = TRUE,
  col_title = NULL,
  col_title_wrap = 25,
  facet_ncol = NULL,
  facet_nrow = NULL,
  facet_scales = "fixed",
  caption = NULL,
  caption_wrap = 80,
  font_family = "Helvetica",
  font_size_title = NULL,
  font_size_body = NULL
)
Arguments
| data | An ungrouped summarised tibble or dataframe. Required input. |
|---|---|
| x_var | Unquoted numeric, date or categorical variable to be on the x axis. Required input. |
| y_var | Unquoted numeric variable to be on the y axis. Required input. |
| col_var | Unquoted variable for points to be coloured by. Required input. |
| facet_var | Unquoted categorical variable to facet the data by. Required input. |
| text_var | Unquoted variable to be used as a customised tooltip in combination with plotly::ggplotly(plot, tooltip = "text"). Defaults to NULL. |
| size_point | Size of points. Defaults to 1. |
| pal | Character vector of hex codes. Defaults to viridis. Use the pals package to find a suitable palette. |
| pal_rev | Reverses the palette. Defaults to FALSE. |
| title | Title string. Defaults to NULL. |
| title_wrap | Number of characters to wrap the title to. Defaults to 70. |
| subtitle | Subtitle string. Defaults to "[Subtitle]". |
| subtitle_wrap | Number of characters to wrap the subtitle to. Defaults to 80. |
| x_balance | For a numeric x variable, add balance to the x scale so that zero is in the centre. Defaults to FALSE. |
| x_expand | Adjust the vector of range expansion constants used to add some padding on the x scale. |
| x_labels | Adjust the x scale labels through a function that takes the breaks as input and returns labels as output. |
| x_pretty_n | For a numeric or date x variable, the desired number of intervals on the x scale, as calculated by the pretty algorithm. Defaults to 6. |
| x_rev | For a categorical x variable, TRUE or FALSE of whether the x variable variable is reversed. Defaults to FALSE. |
| x_title | X scale title string. Defaults to NULL, which converts to sentence case with spaces. Use "" if you would like no title. |
| x_title_wrap | Number of characters to wrap the x title to. Defaults to 50. |
| x_trans | For a numeric x variable, a string specifying a transformation for the x scale, such as "log10" or "sqrt". Defaults to "identity". |
| x_zero | For a numeric x variable, TRUE or FALSE of whether the minimum of the x scale is zero. Defaults to FALSE. |
| x_zero_line | For a numeric x variable, TRUE or FALSE of whether to add a zero reference line to the x scale. Defaults to TRUE if there are positive and negative values in x_var. Otherwise defaults to FALSE. |
| y_balance | For a numeric y variable, add balance to the y scale so that zero is in the centre of the y scale. |
| y_expand | Adjust the vector of range expansion constants used to add some padding on the y scale. |
| y_labels | Adjust the y scale labels through a function that takes the breaks as input and returns labels as output. |
| y_pretty_n | For a numeric or date x variable, the desired number of intervals on the x scale, as calculated by the pretty algorithm. Defaults to 5. |
| y_title | y scale title string. Defaults to NULL, which converts to sentence case with spaces. Use "" if you would like no title. |
| y_title_wrap | Number of characters to wrap the y title to. Defaults to 50. |
| y_trans | For a numeric y variable, a string specifying a transformation for the y scale, such as "log10" or "sqrt". Defaults to "identity". |
| y_zero | For a numeric y variable, TRUE or FALSE of whether the minimum of the y scale is zero. Defaults to TRUE. |
| y_zero_line | For a numeric y variable, TRUE or FALSE whether to add a zero reference line to the y scale. Defaults to TRUE if there are positive and negative values in y_var. Otherwise defaults to FALSE. |
| col_cuts | A vector of cuts to colour a numeric variable. If "bin" is selected, the first number in the vector should be either -Inf or 0, and the final number Inf. If "quantile" is selected, the first number in the vector should be 0 and the final number should be 1. Defaults to quartiles. |
| col_labels_dp | Select the appropriate number of decimal places for numeric variable auto legend labels. Defaults to 1. |
| col_legend_ncol | The number of columns in the legend. |
| col_legend_nrow | The number of rows in the legend. |
| col_method | The method of colouring features, either "bin", "quantile" or "category." If numeric, defaults to "quantile". |
| col_na | TRUE or FALSE of whether to show NA values of the colour variable. Defaults to TRUE. |
| col_title | Colour title string for the legend. Defaults to NULL, which converts to sentence case with spaces. Use "" if you would like no title. |
| col_title_wrap | Number of characters to wrap the colour title to. Defaults to 25. |
| facet_ncol | The number of columns of facetted plots. |
| facet_nrow | The number of rows of facetted plots. |
| facet_scales | Whether facet_scales should be "fixed" across facets, "free" in both directions, or free in just one direction (i.e. "free_x" or "free_y"). Defaults to "fixed". |
| caption | Caption title string. Defaults to NULL. |
| caption_wrap | Number of characters to wrap the caption to. Defaults to 80. |
| font_family | Font family to use. Defaults to "Helvetica". |
| font_size_title | Font size for the title text. Defaults to 11. |
| font_size_body | Font size for all text other than the title. Defaults to 10. |
Value
A ggplot object.
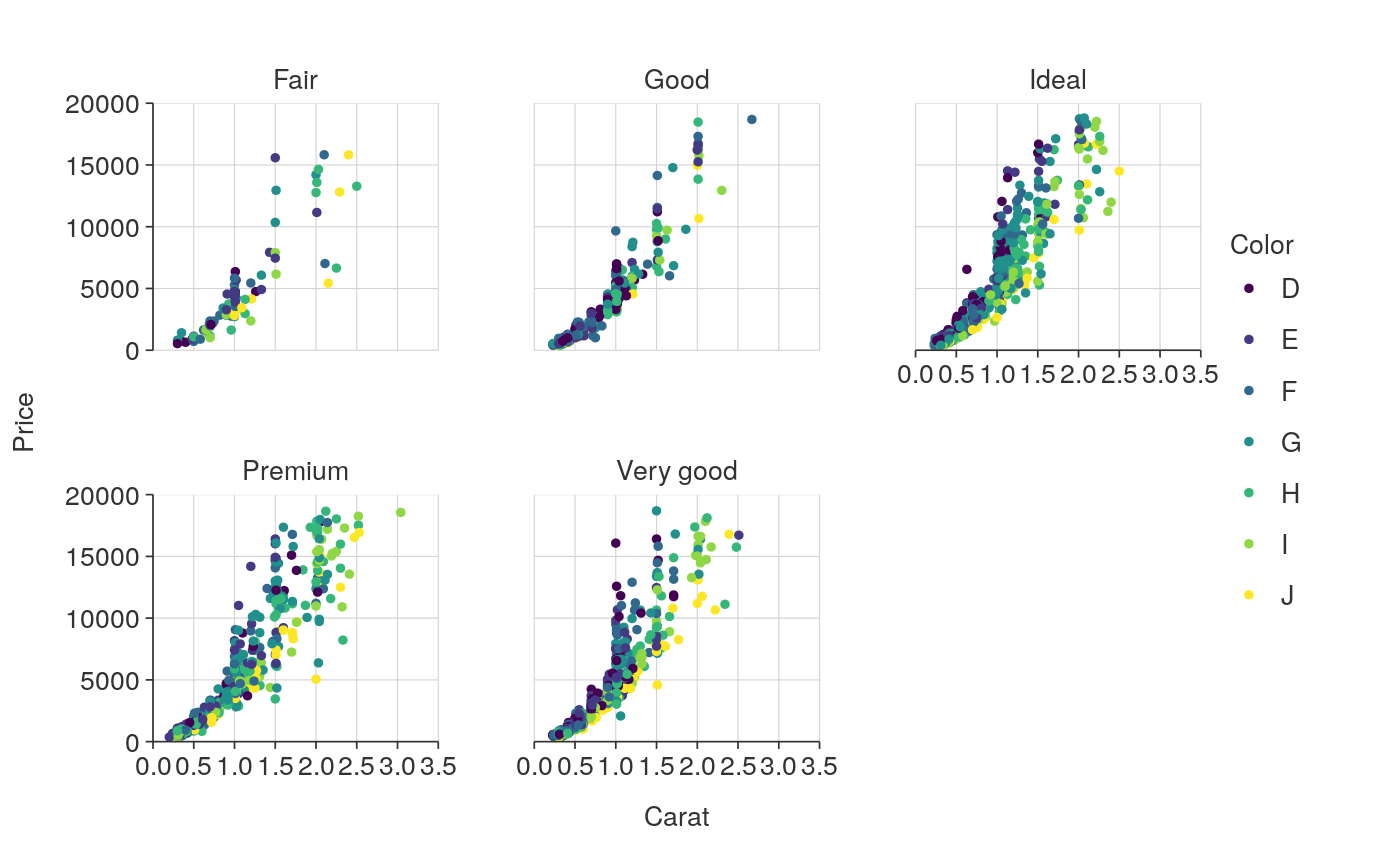
Examples
library(dplyr)

plot_data <- ggplot2::diamonds %>%
  sample_frac(0.05) %>%
  mutate(cut = stringr::str_to_sentence(cut))

ggplot_point_col_facet(plot_data, carat, price, color, cut)